A review of permit data on record with HBW for new swimming pool construction in Texas during 2020
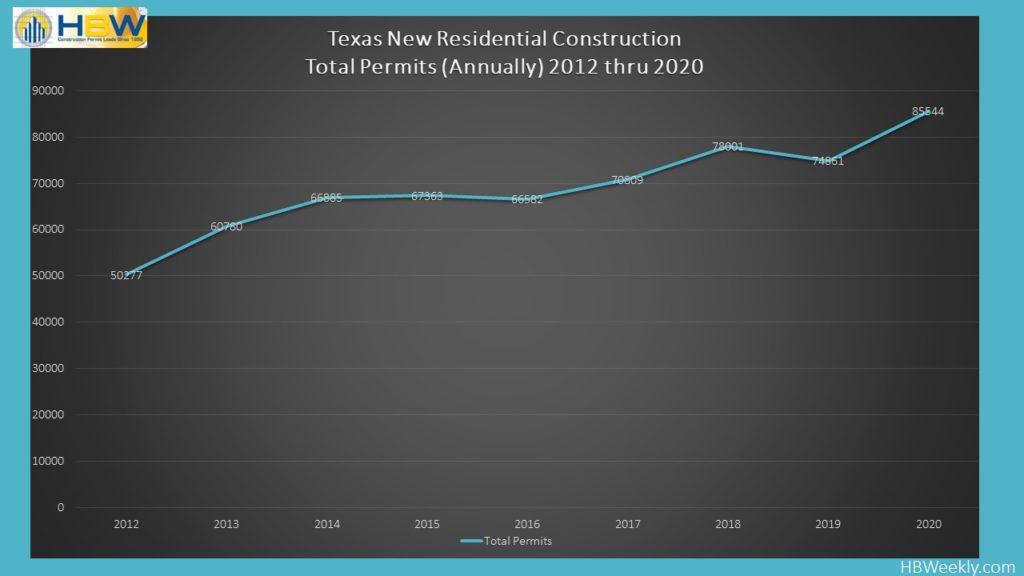
Earlier this week, we reviewed HBW Activity Trend Reports for new residential construction in Texas during 2020, and we identified flourishing markets across the state. Today, we are taking a look at similar permit data and reports, but this time we are specifically covering construction figures for new swimming pool construction last year.
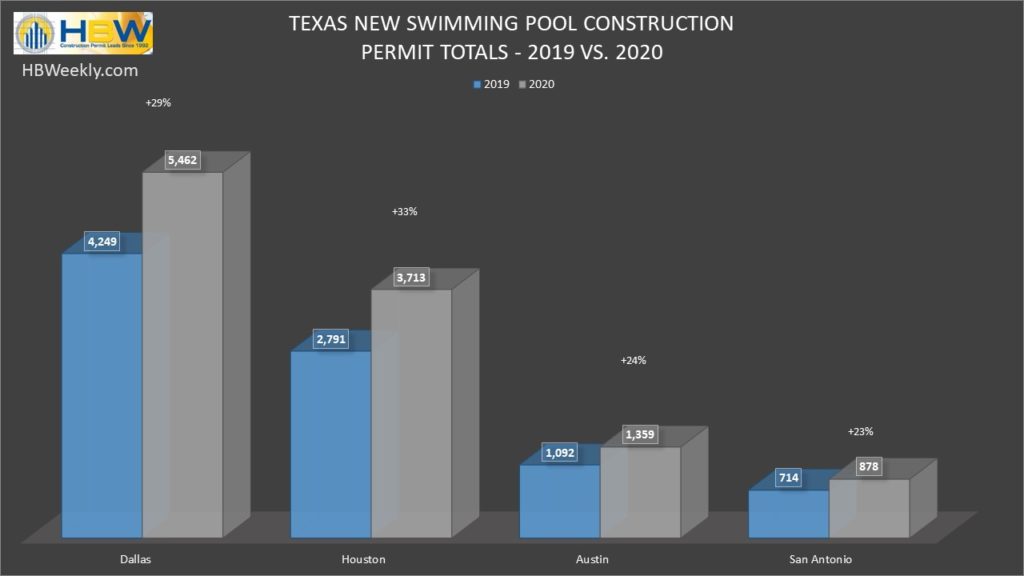
With a 29 percent year-over-year increase in new swimming pool construction permits in 2020, there appears to be a healthy and climbing demand for swimming pools in all four metro areas of Texas (Dallas, Houston, Austin, San Antonio). From January through December, there were 11,412 pool starts, and each metro area experienced major annual spikes in new construction ranging from 23 percent to 33 percent.
Here is a closer look at the total permits and leading counties for new swimming pool construction in each of the four major metropolitan areas of Texas last year:
Dallas
Out of the four Texas regions reviewed, Dallas carried the highest volume of new pool permits last year, having 5,462 starts on record for the one-year period, reflective of a 29 percent year-over-year increase in permits. Out of the six counties that make up the Dallas area, more than half of all new construction took place in Collin County (1,608 permits) and Tarrant County (1,412) where there were year-over-year increases in pool permits of 60 percent and 37 percent respectively.
Houston
In Houston, there were 3,713 pool starts last year, reflecting a 33 percent year-over-year increase in new swimming pool construction. Out of the five counties that make up the Houston area, the bulk of new permits originated from the County of Harris where there were 2,159 permits for the year, reflecting a 26 percent year-over-year increase in new swimming pool construction.
Austin
Last year, there was a 24 percent year-over-year increase in new swimming pool construction in the Austin area, resulting in approximately 1,360 new permits on record with HBW. Out of the four counties that make up the Austin area, Travis County held the greatest concentration of new pool construction activity, having nearly 930 permits on record with HBW for the 12-month period.
San Antonio
In San Antonio, there were nearly 880 new swimming pool construction permits added to the HBW database last year, reflecting a 23 percent year-over-year increase in new pool construction activity. Out of the three counties that make up the San Antonio area, Bexar County held the greatest concentration of new construction activity, having approximately 610 new pool permits on record last year.
To gain more information on the builders, homeowners and permits for the construction activity above, check out HBW for your copy of the latest construction data reports. To gain access to the HBW database and receive custom and detailed reports on the latest residential and commercial building activity in Florida, Georgia, Texas, Alabama, and Oklahoma, please contact HBW for details.