
An HBW report on construction permit data for new swimming pool construction in Texas from January through December 2019
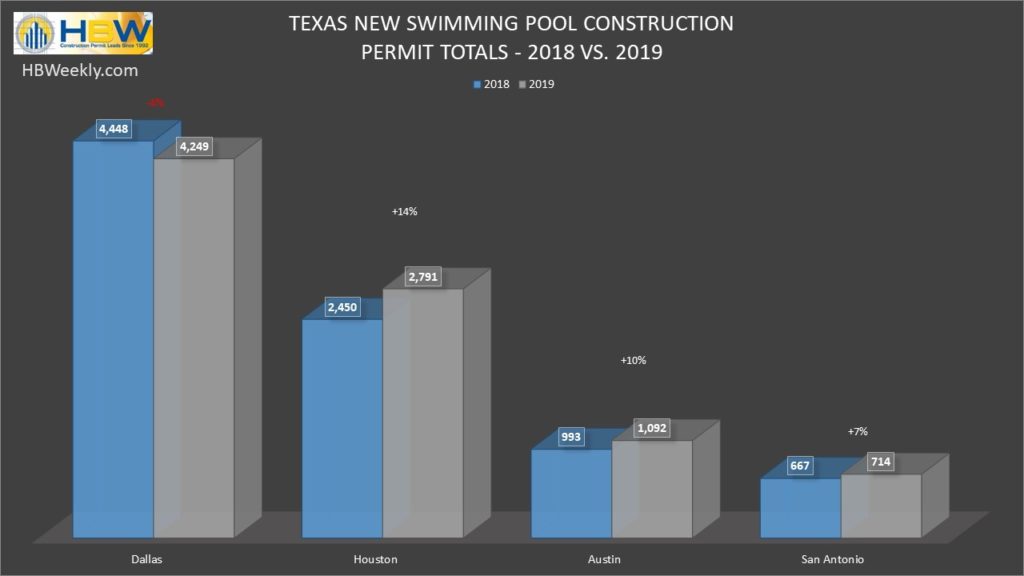
For the last two years, new swimming pool construction has been on the rise in the Lone Star State. Based on HBW’s latest Swimming Pool Construction Activity Trend Report for 2019, Texas experienced a 3 percent year-over-year increase in new pool construction, resulting in nearly 8,850 new permits on record for the one-year period. Out of the four major metro areas reviewed (Dallas, Houston, Austin, San Antonio), Dallas (4,249 permits) held the highest concentration of new swimming pool permits last year, while the Houston area demonstrated the highest rate of growth in new pool construction (+14 percent).
Here is a closer look at the permit totals, leading counties and annual comparisons for new swimming pool construction in Texas last year:
Dallas
As previously mentioned, Dallas carried the greatest total amount of swimming pool starts last year in comparison to other regions reviewed, having nearly 4,250 pool starts on record with HBW. That being stated, Dallas was the only metro area to exhibit a decline in the market as there was a 4 percent decrease in new pool construction in comparison to 2018. Despite the overall and slight slowing in new swimming pool permit activity, pool construction was on the rise in a few counties including Denton County (+3.2 percent) and Rockwall (+14 percent). The majority of new construction and bulk of permits originated from three counties: Tarrant (1,034 permits), Collin (1,008 permits), Dallas (947 permits).
Houston
Houston ranked #2 for new swimming pool construction last year as there were more than 2,790 pool starts on record with HBW. Since 2018, new pool construction has been on the rise in Houston, and in 2019 the area experienced a 14 percent year-over-year increase in new pool permits. More than half of all new construction activity took place in Harris County (1,718 permits) where there was a 21 percent year-over-year increase in new pool construction.
Austin
Last year, the Austin area experienced a 10 percent year-over-year increase in new swimming pool construction, resulting in more than 1,090 new permits on record with HBW for the one-year period. Nearly all new construction took place in Travis County (841 permits) where there was more than a 12 percent year-over-year increase in new pool permitting activity.
San Antonio
In San Antonio, new pool construction has been increasing on an annual basis since 2015 with spikes ranging from 5 percent to 8 percent. Last year, the San Antonio area experienced a 7 percent year-over-year increase in new swimming pool construction, resulting in approximately 715 new permits on record with HBW. The majority of all new construction took place in Bexar County (553 permits) where there was an 8 percent year-over-year increase in new pool permits.
To gain more information on the builders, homeowners and permits for the construction activity above, check out HBW for your copy of the latest construction data reports. To gain access to the HBW database and receive custom and detailed reports on the latest residential and commercial building activity in Florida, Georgia, Texas, Alabama, and Oklahoma, please contact HBW for details.