2019 Report: Metro Atlanta New Swimming Pool Construction

A review of new swimming pool construction permits on record with HBW for Atlanta in 2019Since 2013, the Atlanta area has displayed year-over-year increases in new swimming pool construction ranging from as low as 1 percent to as high as 18 percent, and based on the latest reports from HBW, the growth pattern continued in 2019.  Last year, the Metro Atlanta area experienced a 5 percent year-over-year increase in new swimming pool construction; from January 1 through December 31, 2019, there were approximately 2,370 new swimming pool construction permits added to the HBW database, and more than half of all new construction took place in the following four counties: Fulton, Gwinnett, Cobb and Cherokee.

Here is a closer look at the Metro Atlanta area counties with the greatest concentration of new swimming pool construction last year:

Fulton County

Out of all Metro Atlanta area counties reviewed, Fulton County carried the highest total amount of new pool construction permits last year (total permits: 385).  That being stated, the area was actually behind figures from 2018 by 8 percent, making it the first time in 5 years that the county has experienced an annual decrease in new swimming pool construction. Since 2015, new pool construction has been steadily climbing in Fulton County with year-over-year increases ranging from 5 percent to 14 percent; last year was an exception and indicative of a fluctuation at this point rather than a pattern.

Cobb County

For the most part, new pool construction in Cobb County has been increasing since 2015.  From 2015 through 2017, the area experienced gains in new pool construction ranging from 6 percent to 35 percent, and in 2018 there was a fluctuation in the form of a 6 percent year-over-year decline.  Based on last year’s figures, Cobb County appears to be back on its upward growth pattern, having more than 300 pool starts on record with HBW, reflecting a 6 percent year-over-year increase.

Gwinnett County

Since 2015, Gwinnett County has experienced annual increases in new swimming pool construction.  That being stated, new pool construction appears to be holding somewhat steady in the area, as there was a a minimal 4 percent decrease in pool starts resulting in 212 new pool permits last year.

Cherokee County

Over the last five years, new swimming pool construction has fluctuated in Cherokee County from year to year, but overall the pattern is making its way upward.  In 2019, the area experienced a 4 percent year-over-year increase in new pool construction, resulting in 206 new pool permits being added to the HBW database.

Information utilized for the above listed figures for Metro Atlanta residential construction was directly derived from HBW construction data reports. To gain access to the HBW database and receive custom and detailed reports on the latest residential and commercial building activity in Florida, Georgia, Texas, Alabama, and Oklahoma, please contact HBW for details.

Texas Residential Construction Report – December 2019

A review of construction data for new residential construction in Texas during the month of December 2019

In the last month of 2019, new residential construction in Texas experienced a month-over-month decrease of approximately 5 percent.  From the combined metro areas of Dallas, Houston, Austin and San Antonio, there were nearly 5,460 new residential construction permits with a total construction value in excess of $1.35 billion added to the HBW database.  Out of four major metro areas reviewed, Houston (2,074 permits) ranked #1 for total new permits on record, while Dallas (average value: $289k+) carried the highest average value of new home construction for the one-month period.

Here is a closer look at the latest new residential construction data based on permits added to the HBW database during the month of December 2019:

Houston

The Houston area ranked #1 for new home construction last month, having nearly 2,075 housing starts with a total construction value of approximately $434 million.  The average value of new home construction remained lowest in Houston (average value: $209,196) in comparison to the other Texas metro areas reviewed, and nearly half of all permits originated from the County of Harris (907 permits).

Dallas

Not far behind Houston, Dallas ranked second for total new residential construction permits, having more than 2,020 housing starts with a total construction value in excess of $584 million last month.  As previously mentioned, Dallas maintained its lead for higher value construction (average value: $289k+), and more than half of all new home construction took place in the two counties of Tarrant County (646 permits) and Collin County (481 permits).

Austin

Last month, there were more than 850 housing starts with a total construction value of approximately $208 million in the Austin area.  The average value of new home construction landed in the mid-range (average value: $244,269) in comparison to the other metro areas reviewed, and the bulk of permits originated from Travis County (499 permits).

San Antonio

In San Antonio, there were nearly 510 housing starts with a total construction value of $128.5 million during the month of December 2019.  The average value of new home construction was $252,427, and the majority of new residential construction activity took place in Bexar County (368 permits).

To gain more information on the builders, homeowners and permits for the construction activity above, check out HBW for your copy of the latest construction data reports. To gain access to the HBW database and receive custom and detailed reports on the latest residential and commercial building activity in Florida, Georgia, Texas, Alabama, and Oklahoma, please contact HBW for details.
Florida Top Swimming Pool Builders – November 2019

A review of the leading pool builders in Florida based on the total number of new permits on record with HBW during the month of November 2019

As reviewed earlier this week in our most recent post “Florida Swimming Pool Construction Update – November 2019”, there were 1,875 new swimming pool permits added to the HBW database for Florida during the month of November 2019.  When looking at the leading pool builders/contractors driving new construction activity, results vary greatly based on region.  For this reason, we have segmented the reports to focus on the top five builders from each of the five regions reviewed (Tampa, Southwest, Orlando, Southeast, Jacksonville) based on the total number of new permits pulled for the one-month period.  The results are as follows:

Southwest

During November 2019, the southwest region of Florida carried the greatest concentration of new pool construction activity in comparison to other Florida regions reviewed.  During the one-month period, there were more than 650 new swimming pool permits added to the HBW database, and out of the approximately 135 active contractors with new pool construction activity on record, the following ranked as the top five for total new permits:

Builder
1-Aragon Pools & Spas
2-Coast to Coast Pools
3-Pinnacle USA
4-Serenity Pool & Spa
5-Waterscapes Pools & Spas


Orlando

The Orlando area ranked #2 for total swimming pool starts during the month of November as there were approximately 400 new permits on record for the one-month period.  Out of the more than 100 pool contractors with permits on record for the month, the following ranked as the top five for total new permits:

Builder
1-Bob’s Pool Service
2-Intercoastal Pool & Spa Builders
3-Dreamscapes Pools & Spas
4-Atlas Pools of Central Florida
5-Martin Pools


Southeast

In the southeastern region of Florida, there were more than 340 new swimming pool construction permits added to the HBW database, and out of the nearly 140 contractors with new construction activity on record for the month, the following ranked as the top five for total new permits:

Builder
1-A & G Concrete Pools
2-Swimming Pool Contractors
3-Louden Bonded Pools
4-Pools by Greg
5-Crystal Pools


Tampa

In Tampa there were nearly 330 swimming pool starts during the month of November, and out of the approximately 100 pool contractors with new construction activity on record for the month, the following ranked as the top five for total new permits:

Builder
1-Tampa Bay Pools
2-Olympus Pools
3-Gulfstream Pools & Spas
4-T & D Pool & Spa Construction
5-Challenger Pools


Jacksonville

In Jacksonville, there were more than 150 pool starts on record for the month of November, and out of the 55 active pool contractors with new permits on file for the month, the following ranked as the top five for total new permits:

Builder
1-Pools by John Clarkson
2-Kerry Martin Pools
3-All Seasons
4-Pools & Spas of Central Fla
5-Island Pools


To gain more information on the builders, homeowners and permits for the construction activity above, check out HBW for your copy of the latest construction data reports. To gain access to the HBW database and receive custom and detailed reports on the latest residential and commercial building activity in Florida, Georgia, Texas, Alabama, and Oklahoma, please contact HBW for details.
Florida Swimming Pool Construction Update – November 2019

A review of the latest swimming pool construction permit data on record with HBW for the month of November 2019

Based on the latest construction data reports available from HBW, there were 1,875 new swimming pool construction permits with a total value in excess of $89 million in Florida during the month of November 2019.  Out of the five major regions reviewed (Southwest, Tampa, Southeast, Orlando, Jacksonville), the southwest region (652 permits) held the greatest amount of swimming pool starts, and Tampa carried the highest average value of new pool construction (average value: $53,021).

Here is a closer look at new permit details by region throughout the Sunshine State from November 1-30, 2019:

Southwest

As previously mentioned, the southwest region of Florida carried the greatest amount of swimming pool starts during the month of November 2019, having 652 new permits with a total construction value of approximately $30.4 million added to the HBW database.  The average value of new construction (average value: $46,656) landed in the low to mid-range in comparison to other regions reviewed, and more than half of all new construction took place in the counties of Lee (215 permits) and Collier (142 permits).

Orlando

Orlando ranked #2 for new swimming pool construction in Florida during November 2019, having approximately 400 new permits with a total construction value of nearly $18 million for the one-month period.  The average value of new construction was lowest in Orlando (average value: $44,735) in comparison to other regions reviewed, and more than half of all new construction originated from Orange County (112 permits) and Brevard County (104 permits).

Southeast

In the southeastern region of Florida there were more than 340 swimming pool starts with a total construction value of nearly $15.7 million during the month of November 2019.  The average value of new pool construction was $45,763, and the bulk of all new pool construction took place in the counties of Palm Beach (120 permits) and Miami-Dade (87 permits).

Tampa

During the month of November, there were 328 new swimming pool construction permits with a total value of nearly $17.4 million added to the HBW database for the Tampa area.  In comparison to other regions reviewed, Tampa held the highest average value of new pool construction (average value: $53,021), and the county with the greatest concentration of new pool construction activity was Hillsborough County with 114 new permits on record for the one-month period.

Jacksonville

In Jacksonville, there were just over 150 new swimming pool permits with a total construction value of approximately $7.8 million on record with HBW during the month of November. The average value of new swimming pool construction was $50,684, and the majority of new construction activity took place in the counties of St. Johns (64 permits) and Duval (41 permits).

To gain more information on the builders, homeowners and permits for the construction activity above, check out HBW for your copy of the latest construction data reports. To gain access to the HBW database and receive custom and detailed reports on the latest residential and commercial building activity in Florida, Georgia, Texas, Alabama, and Oklahoma, please contact HBW for details.
Florida’s Top Home Builders – November 2019

A review of leading contractors in Florida with the greatest total amount of new residential construction permits on file with HBW during the month of November 2019

As reviewed earlier this week in a post titled “Florida Residential Construction Report – November 2019”, there were more than 5,550 housing starts added to the HBW database for Florida last month.  Across the state, the two leading home builders that led new residential construction were D.R. Horton (693 permits) and Lennar Homes (712 permits), each having approximately 700 or more new permits on record for the month.

Here is a look at the top five leading home builders in Florida last month, based on total number of new residential construction permits and by geographic area:

Tampa

Out of the 190 contractors with new home construction on record in the Tampa area last month, the following ranked as the top five for total new permits:

Builder Total Permits
Lennar Homes 297
The Villages of Lake Sumter 157
D.R. Horton 106
Pulte Homes 103
Highland Homes 62


Southwest

Last month, there were more than 230 active home builders in the southwest region of Florida with new residential construction activity on record with HBW, and the following ranked as the top five for total new permits:

Builder Total Permits
D.R. Horton 247
Lennar Homes 152
Pulte Homes 151
Taylor Morrison 70
Neal Communities of SW FL 53


Southeast

Out of 145 home builders with new permits on record in the southeast region of Florida for the month, the following ranked as the top five for total new permits:

Builder Total Permits
G L Building Corp 104
D.R. Horton 84
Lennar Homes 65
Pulte Homes 46
Holiday Builders 34


Orlando

Last month, there were nearly 150 active contractors in the Orlando area with new construction activity on record with HBW, and the following ranked as the top five for total new permits:

Builder Total Permits
Lennar Homes 116
D.R. Horton 112
Mattamy Homes 92
Meritage Homes 63
Ryan Homes 43


Jacksonville

Out of the more than 115 active home builders with new home construction activity on record in Jacksonville for the month, the following ranked as the top five for total new permits:

Builder Total Permits
D.R. Horton 144
Lennar Homes 82
Dream Finders Home 60
Mattamy Homes 58
Richmond American Homes 56

To gain more information on the builders, homeowners and permits for the construction activity above, check out HBW for your copy of the latest construction data reports. To gain access to the HBW database and receive custom and detailed reports on the latest residential and commercial building activity in Florida, Georgia, Texas, Alabama, and Oklahoma, please contact HBW for details.

Florida Residential Construction Report – November 2019

A review of the latest permit data for new home construction in Florida during the month of November 2019

Based on the latest reports from the HBW database, there were more than 5,550 housing starts with a total construction value of approximately $1.5 billion in the Sunshine State last month.   Out of the five major regions reviewed (Tampa, Orlando, Jacksonville, Southeast, Southwest), the Tampa area held the highest amount of total new residential construction permits (1,525 permits), while Orlando held the highest average value of new home construction (average value: $294,616).

Here is a closer look at new construction activity by region, including total permits, average value of construction and counties where new home construction was greatest during the month of November 2019:

Tampa

Total permits: 1,525 permits

Average Value of Construction: $277,058

Top Counties for new construction: Polk County (432 permits); Hillsborough County (396 permits)

Southwest

Total permits: 1,355 permits

Average Value of Construction: $256,378

Top Counties for new construction: Lee County (473 permits); Sarasota County (274 permits)

Orlando

Total permits: 1,107 permits

Average Value of Construction: $294,616

Top Counties for new construction: Orange County (351 permits); Brevard County (226 permits)

Jacksonville

Total permits: 837 permits

Average Value of Construction: $240,140

Top Counties for new construction: Duval County (296 permits); St. Johns County (286 permits)

Southeast

Total permits: 729 permits

Average Value of Construction: $291,223

Top Counties for new construction: St. Lucie County (252 permits); Palm Beach County (177 permits)

To gain more information on the builders, homeowners and permits for the construction activity above, check out HBW for your copy of the latest construction data reports. To gain access to the HBW database and receive custom and detailed reports on the latest residential and commercial building activity in Florida, Georgia, Texas, Alabama, and Oklahoma, please contact HBW for details.
Texas Top Pool Builders – November 2019

A review of the leading swimming pool contractors by area in Texas during the month of November 2019

Earlier this week, we reported on the latest permit data available for new swimming pool construction in the four major metro areas of Texas (Dallas, Houston, Austin, San Antonio).  Based on the same report, today we are breaking down the data even further to identify the leading swimming pool contractors driving new construction in each metro area.

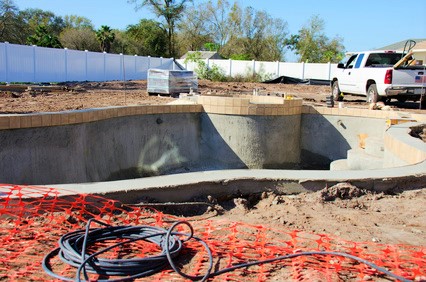
As previously reported in “HBW Report: Texas Swimming Pool Construction – November 2019”, there were nearly 630 swimming pool starts in Texas last month, with approximately 80 percent of all new construction taking place in Dallas and Houston.  When reviewing contractors with new and active pool permits on file with HBW for the one-month period, the results for leading pool builders are widely varied by area.  For this reason, we have extracted the top five pool contractors by metro area based on the total number of new swimming pool construction permits on record during the month of November 2019; the results are as follows:

Dallas

Dallas held the greatest concentration of new pool construction activity last month in comparison to other Texas metro areas.  During the month of November 2019, there were more than 300 new swimming pool permits in the Dallas area, and out of the nearly 120 active contractors with new pool construction on record, the following ranked as the top five for total new permits:

Builder
1-Riverbend Pools
2-Gold Medal Pools
3-Foley Custom Pools
4-Hobert Pools
5-Puryear Custom Pools


Houston

In Houston, there were more than 200 pool starts last month, and out of the nearly 85 active pool contractors in the area for the one-month period, the following ranked as the top five for total new permits on record with HBW:

Builder
1-Platinum Pools
2-Anthony & Sylvan Pools
3-Cypress Custom Pools
4-Premier Pools
5-Regal Pools


Austin

Last month, there were nearly 70 pool starts in Austin, and out of the more than 35 active contractors with permits on record for the month, the following ranked as the top five for total new permits in the area:

Builder
1-Cody Pools
2-Fun N Sun Pools of Austin
3-Anthony & Sylvan Pools
4-Texas Pools & Patios
5-Reliant Pools


San Antonio

In San Antonio there were just over 50 swimming pool starts on record last month, and out of the nearly 20 pool contractors with new construction activity on record for the month, the following ranked as the top five for total new permits:

Builder
1-Keith Zars Pools
2-Cody Pools
3-Blue Haven Pools
4-Anthony & Sylvan Pools
5-Alamo Pool Builders


To gain more information on the builders, homeowners and permits for the construction activity above, check out HBW for your copy of the latest construction data reports. To gain access to the HBW database and receive custom and detailed reports on the latest residential and commercial building activity in Florida, Georgia, Texas, Alabama, and Oklahoma, please contact HBW for details.
HBW Report: Texas Swimming Pool Construction – November 2019

A review of the latest permit data on file with HBW for new swimming pool construction in Texas during the month of November 2019

Based on the latest data available from the HBW database, there were nearly 630 swimming pool starts with a total construction value of approximately $31.6 million in Texas last month.  Out of the four major metro areas reviewed (Dallas, Houston, Austin, San Antonio), Dallas had the greatest total amount of new swimming pool construction permits for the month (total permits: 304), and Austin held the highest average value of new construction (average value: $64.3k).

Here is a closer look at the total number of permits, average values of construction and counties where new pool construction ranked high during the month of November 2019:

Dallas

As mentioned above, Dallas ranked #1 for new swimming pool construction as there were more than 300 pool starts with a total construction value of more than $12.8 million last month.  The average value of construction landed on the lower to mid-range in comparison to other metro areas reviewed (average value: $42,225), and approximately half of all new construction took place in Collin County (80 permits) and Tarrant County (72 permits).

Houston

Houston ranked second for total pool starts having more than 200 new swimming pool permits with a total construction value of nearly $13 million added to the HBW database last month.  The average value of construction landed on the higher end of the spectrum (average value: $63,127) in comparison to other Texas metro areas, and the majority of all new construction took place in Harris County (151 permits).

Austin

Last month, there were nearly 70 new swimming pool permits with a total construction value of approximately $4.4 million in Austin.  As previously mentioned, the average value of construction was highest in Austin (average value: $64,305) in comparison to other areas reviewed, and the bulk of new permits originated from Travis County (56 permits).

San Antonio

In San Antonio, there were just over 50 swimming pool starts with a total construction value in excess of $1.5 million last month.  The average value of construction was lowest in San Antonio (average value: $30,196) in comparison to the other metro areas reviewed, and the majority of new construction activity took place in Bexar County (37 permits).

To gain more information on the builders, homeowners and permits for the construction activity above, check out HBW for your copy of the latest construction data reports. To gain access to the HBW database and receive custom and detailed reports on the latest residential and commercial building activity in Florida, Georgia, Texas, Alabama, and Oklahoma, please contact HBW for details.

Texas Top Home Builders – November 2019

A review of the leading home builders in Texas based on total new permits on record with HBW for the month of November 2019

Earlier this week, we reviewed and posted a report (“Texas Residential Construction Review – November 2019”) on the latest permit data for new residential construction in Texas.  While the previous report covered information regarding total permits, construction values and top counties for new residential construction, today we are taking a look at the leading builders driving those figures for the month.

Across the primary metro areas of Texas (Dallas, Houston, Austin, San Antonio), there were nearly 5,800 total housing starts last month, and the Houston and Dallas markets were dominated by D.R. Horton.  The mega builder landed on the top five list of nearly all metro areas, having more than 740 new permits on file with HBW for the one-month period.

Another major player in new residential construction is Lennar Homes.  In addition to leading the Austin area with 74 permits, Lennar Homes ranked second for total housing starts with 327 total new permits added to the HBW database for Texas last month.  Other notable home builders with widespread housing starts last month include: KB Homes (250 permits), Pulte Homes (214 permits) and LGI Homes (183 permits).

When reviewing leading companies across the state, the following ranked as the top five home builders for total new permits on file during the month of November 2019:

Houston

Last month, there were more than 270 home builders with new residential construction permits on record in the Houston area, and the following ranked as the top five for total new permits:

Builder Total Permits
D.R. Horton 350
K. Hovnanian Homes 145
Lennar Homes 137
Perry Homes 130
KB Homes 124


Dallas

In Dallas, there were more than 220 active home builders with housing starts on record last month, and the following ranked as the top five for total new permits:

Builder Total Permits
D.R. Horton 328
LGI Homes 121
Lennar Homes 82
First Texas Homes 66
Bloomfield Homes 58


Austin

Out of the more than 95 active contractors in Austin with permits on file for the month of November, the following ranked as the top five for total new residential construction permits:

Builder Total Permits
Lennar Homes 74
D.R. Horton 63
KB Homes 56
Pulte Homes 51
Gehan Homes 39


San Antonio

Out of the approximately 70 home builders with housing starts on file in the San Antonio area last month, the following ranked as the top five for total new residential construction permits:

Builder Total Permits
KB Homes 56
Fieldstone Communities S.A. 43
Continental Homes of Texas 39
Lennar Homes 34
M/I Homes 27

To gain more information on the builders, homeowners and permits for the construction activity above, check out HBW for your copy of the latest construction data reports. To gain access to the HBW database and receive custom and detailed reports on the latest residential and commercial building activity in Florida, Georgia, Texas, Alabama, and Oklahoma, please contact HBW for details.
Texas Residential Construction Review – November 2019

A review of the latest permit data for new residential construction in Texas during the month of November 2019

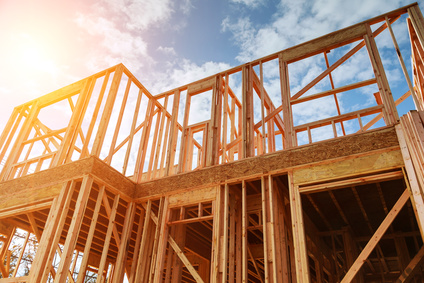
The latest permits and data for new home construction in Texas are available in the HBW database, and during the month of November 2019, there were nearly 5,800 new residential construction permits with a total construction value of approximately $1.4 billion. Out of the four major metro areas reviewed (Houston, Dallas, Austin, San Antonio), Houston held the highest concentration of housing starts (2,678 permits), and Dallas maintained it lead for holding the highest average value of new construction (average value: ~$286.5k).

Here is a closer look at the total permits, construction values and leading counties for new home construction in Texas last month:

Houston

As previously mentioned, Houston ranked #1 for total new residential construction permits on record last month, having 2,678 housing starts with a total construction value in excess of $505 million.  The average value of construction was lowest in Houston in comparison to the other metro areas reviewed (average value: $188,630), and the county with the highest concentration of new permits was Harris County (1,495 permits).

Dallas

Last month, there were approximately 1,930 housing starts with a total construction value of more than $552.5 million in the Dallas area.  The average value of construction was higher in Dallas (average value: $286,459) than other metro areas reviewed, and more than half of all new residential construction took place in the counties of Collin (519 permits) and Tarrant (515 permits).

Austin

In Austin, there were 715 new residential construction permits with a total construction value of nearly $187.5 million added to the HBW database during the month of November.  The average value of construction was $262,169, and more than half of all new permits originated from Travis County (411 permits).

San Antonio

In San Antonio and surrounding areas there were nearly 470 housing starts with a total construction value of more than $111 million last month.  The average value of construction landed mid-range (average value: $238,747) in comparison to other areas reviewed, and the bulk of new residential construction activity took place in Bexar County (312 permits).

To gain more information on the builders, homeowners and permits for the construction activity above, check out HBW for your copy of the latest construction data reports. To gain access to the HBW database and receive custom and detailed reports on the latest residential and commercial building activity in Florida, Georgia, Texas, Alabama, and Oklahoma, please contact HBW for details.