
A look at the latest permit data for new swimming pool construction in Florida from January through June 2020
Over the last five years, new swimming pool construction has been on a steady climb in the Sunshine State. Since 2015, the market has demonstrated year-over-year increases ranging from 4 percent to 14 percent, and the pattern appears to be holding true so far this year.
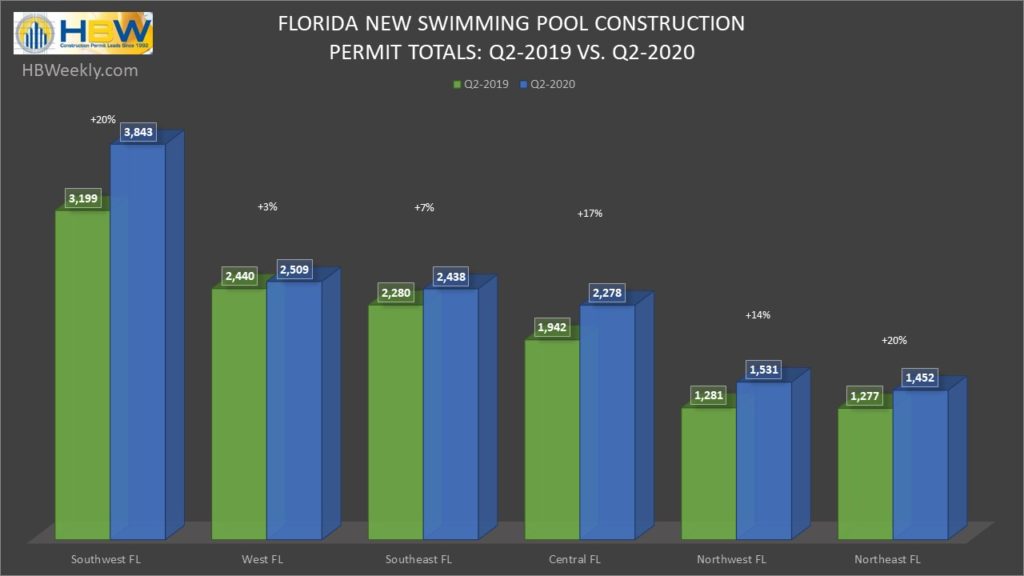
Through Q2-2020, there has been a 13 percent year-over-year increase in pool starts in Florida, resulting in more than 14,050 new swimming pool construction permits being added to the HBW database. Out of the six Florida regions reviewed (Central, Southeast, Southwest, West, Northwest, Northeast), the highest volume of new swimming pool construction permits could be found in the southwestern region of the state, as there have already been nearly 3,850 pool starts resulting from a 20 percent year-over-year increase in new construction activity.
All areas reviewed have exhibited year-over-year spikes in new pool construction ranging from 3 percent to 20 percent, with areas like Central and Southeast Florida appearing to be recovering from annual dips in swimming pool construction last year.
Here is a breakdown of total permits, YOY growth rates and leading counties by region:
Southwest Florida
As previously mentioned, there has been a 20 percent year-over-year increase in pool construction in the southwest region of Florida, resulting in nearly 3,850 pool starts on record with HBW through the second quarter of this year. Out of the five counties reviewed, the county with the highest concentration of new pool permits was Lee County where there has been a 35 percent year-over-year increase in new pool construction that resulted in nearly 1,290 new permits for the six-month period.
West Florida
From January through June 2020, there have been approximately 2,510 pool starts in West Florida, reflective of a 3 percent year-over-year increase in new swimming pool construction. Out of the seven counties reviewed, more than half of all new permits originated from the two counties of Hillsborough (772 permits) and Pasco (527 permits), where there were year-over-year increases in pool construction ranging from 1 percent to 8 percent respectively.
Southeast Florida
In the southeastern region of Florida there have been approximately 2,440 pool starts since the start of this year (thru June 2020), reflecting a 7 percent year-over-year increase in new swimming pool construction. Out of the seven counties reviewed, the greatest concentration of pool starts could be found in Palm Beach (925 permits) and Miami-Dade (671 permits), with both areas demonstrating year-over-year increase in permits of 13 percent and 20 percent respectively.
Central Florida
Through Q2-2020 there have been approximately 2,280 pool starts in the Central Florida area, reflecting a 17 percent year-over-year increase in new swimming pool construction. Out of the six counties reviewed, well more than half of all new pool construction originated from the counties of Orange (741 permits) and Osceola (550 permits), with both areas demonstrating year-over-year increases 7 percent (Orange) and 24 percent (Osceola) in new pool construction.
Northwest Florida
In the northwestern region of Florida, there have been more than 1,530 new swimming pool construction permits added to the HBW database through the second quarter of this year, reflecting a 20 percent year-over-year increase in pool starts. Out of the 18 counties reviewed, the highest concentration of new pool construction could be found in Santa Rosa County (305 permits), where there has been an 18 percent year-over-year increase in new swimming pool construction.
Northeast Florida
Through Q2-2020, the northeastern region of Florida has experienced a 14 percent year-over-year increase in new swimming pool construction, resulting in more than 1,450 new permits on record with HBW. Out of the eight counties reviewed, more than half of all new permitting activity took place in the counties of St. Johns (569 permits) and Duval (329 permits). While Duval County’s market appears to be holding somewhat steady with last year, St. Johns appears to be continuing its growth pattern as there has already been a 32 percent year-over-year increase in swimming pool construction.
To gain more information on the builders, homeowners and permits for the construction activity above, check out HBW for your copy of the latest construction data reports. To gain access to the HBW database and receive custom and detailed reports on the latest residential and commercial building activity in Florida, Georgia, Texas, Alabama, and Oklahoma, please contact HBW for details.Save