Tips for Increasing Website Traffic

A review of a few basic actions you can take now to attract more visitors to your company’s website

When most of us hear the word “traffic” we cringe, thinking of stress-inducing waiting times and crowded roadways, but when it comes to your website “traffic” is exactly what you need.  It’s quite simple really… the more traffic you have, the more visibility you gain, and ultimately the more potential customers are viewing your products and/or services.

So, how do we go about increasing website traffic?  Of course, there is the obvious – launch ad campaigns, pay for “clicks” and pave the road with paid ads across all possible “on ramps” to your site, but ads are simply not enough.  With the advancements in SEO and Google rankings, you will need to do more than pay for an ad here and there, not to mention the fact that larger companies with deeper pockets may be making your ad a small fish in a big pond.

For this reason, here are a few cost-effective actions you can take now to increase traffic to your website:

1 – Backlinks – While the word may sound technical or like some sort of secret way to gain access to your website, it is really one of the most basic ways to organically increase web traffic and improve your rankings with search engines.  Backlinks are merely other websites providing a hyperlink back to your website – Yes, it’s that simple.  By having other websites (think trade associations, industry partners, blogs, publications, etc.) offer a link back to your website, you are creating an indirect endorsement in the eyes of search engines; it’s a bit like one company saying, “I approve of this other company, so go ahead and take a look”.  And while it may be tempting, you should never create excessive backlinks with partners just for the sake of backlinks, and you certainly do not want to purchase backlinks; if you are identified as a site that has purchased backlinks, Google has the right to penalize you by removing your site from search results – not a punishment any business wants to face.

2- Security – When we talk about security of your website, we are not talking about bouncers and bodyguards.  Instead, we are talking about SSL certificates and secure online payments (if you have an online store).  Believe it or not, many websites are not secure, and attaining an SSL certificate costs very little in both time and money.  As for the bouncers and bodyguards, that will come in the form of taking appropriate steps to ensure that your website has a reliable host and running on the most updated version of the website builder/platform.

3- Mobilize – No, you don’t have to move anywhere, but you will want to make sure that your site is available to visitors who are “on the move”. Search engines (and users) are weighing the mobile experience of websites heavier than that of the desktop. According to recent reports, just about 70 percent of all web traffic originates from smartphones; those are statistics that make it worthwhile to optimize the mobile experience.

4 – Keep Up the Pace – Although speed is not usually the first thing we think about from a marketing perspective, the speed of your website plays an important role in keeping visitors on any given page.  In fact, it has been reported that just a one second delay on a website reduces customer satisfaction by 16 percent, not to mention that speed can also impact your website’s performance with search engines.  Just test it for yourself – Clear your history and cache on your browser (or use a browser that has not previously visited your site) and go to your website to see how quickly the images and pages load.  If it takes too long for the full page and all content to be front and center, it is time to review and maybe even upgrade your website.  Delays can be caused by multiple factors, including but not limited to excessively large media files, bulky code, missing files, invalid links and more.

5 – Aim for Your Target – In order for your ads, links and online marketing (and all marketing) efforts to be effective, you will need to know your target audience.  Where is the greatest need for your services, who is your competition, and what is the market doing right now?  The good news for HBW subscribers is that you have access to market trend reports and construction permit data that enable you to identify hot spots for your services and competition, as well as use archived reports to assess and monitor fluctuations and patterns in the market.

So, what are you waiting for?  Start gaining visibility for your website by creating secure and reliable roadways where heavy traffic is a welcome sign of success.


For more information on construction business marketing tips, stay connected with the HBW Blog.  To get ahead of construction activity and gain access to the latest permitting data in Florida, Texas, Georgia, Alabama and Oklahoma, contact HBW for more information on construction data reports and industry leads.

Florida Swimming Pool Construction Report – April 2021

A monthly review of the latest permit data for new swimming pool construction in Florida during the month of April 2021

Based on the latest construction data reports from HBW, there were approximately 2,850 new swimming pool permits with a total construction value in excess of $144 million added to the HBW database for Florida during the month of April 2021.  Out of the five major regions reviewed (Southwest, Tampa, Orlando, Southeast, Jacksonville), the greatest volume of new pool permits could be found in the Southwest (977 permits), while the highest average value of new swimming pool construction could be found in the Jacksonville area (average value: $57,341).

From total permits and average construction values to leading counties and contractors, here is breakdown of the permit data available from the HBW database for new swimming pool construction in Florida during the month of April:

Southwest

As previously noted, the southwestern region of Florida carried greatest concentration of new swimming pool construction in comparison to other Florida regions reviewed, having 977 new permits with a total construction value in excess of $48.5 million.  The average value of new pool construction was $49,660, and the majority of all permits originated from the counties of Lee and Collier where there were 379 and 256 permits respectively.

Out of the more than 170 contractors with new swimming pool construction on record with HBW for the southwestern region of Florida in April, the following ranked as the top three for total permits:

Builder Total Permits
1-Aragon Pools & Spas 147
2-Pinnacle USA 54
3-Serenity Pool & Spa 43

Southeast

The southeastern region of Florida ranked #2 for new pool construction, having 626 permits with a total construction value of nearly $26.5 million.  The average value of new pool construction was lowest in the Southeast (average value: $42,265) in comparison to other regions reviewed, and the county with the highest concentration of new pool construction activity was Palm Beach (228 permits).

Out of the approximately 200 contractors with new swimming pool construction in the southeastern region of Florida during the month of April, the following ranked as the top three for total permits:

Builder Total Permits
1-Swimming Pool Contractors 53
2-Van Kirk & Sons 22
3-Fountain Blue Pool Services 22

Orlando

During the month of April, there were more than 505 new swimming pool construction permits with a total value of approximately $28 million added to the HBW database for Orlando.  The average value of new pool construction was $55,081, and nearly half of all new permits originated from Orange County (236 permits).

Out of the approximately 120 contractors with new swimming pool construction on record for Orlando during the month of April, the following ranked as the top three for total permits:

Builder Total Permits
1-American Pools & Spas 36
2-Holland Pools 31
3-All Seasons 28

Tampa

In Tampa, there were 437 new swimming pool permits with a total construction value of nearly $24 million added to the HBW database for the month of April.  The average value of new pool construction was $54,537, and the county with the greatest concentration of new pool construction activity was Pasco County where there were 146 new permits for the one-month period.

Out of the more than 115 contractors with new swimming pool construction on record for Tampa in April, the following ranked as the top three for total permits:

Builder Total Permits
1-Tropical Escapes Pool & Spa 30
2-T&D Pool Construction 24
3-Bob’s Pool Service 22

Jacksonville

During the month of April, Jacksonville carried the least amount of new swimming pool construction activity in comparison to other regions reviewed, having just over 300 new permits with a total construction value in excess of $17.3 million; at the same time, Jacksonville exhibited the highest average value of new swimming pool construction (average value: $57,341), and well more than half of all new permits originated from the counties of St. Johns (133 permits) and Duval (71 permits).

Out of the nearly 90 contractors with new swimming pool construction on record in the Jacksonville area for the month of April, the following ranked as the top three for total permits:

Builder Total Permits
1-Waterside Pools 16
2-Pools by John Clarkson 15
3-Stanley Pools 12


To gain more information on the builders, homeowners and permits for the construction activity above, check out HBW for your copy of the latest construction data reports. To gain access to the HBW database and receive custom and detailed reports on the latest residential and commercial building activity in Florida, Georgia, Texas, Alabama, and Oklahoma, please contact HBW for details.

Florida Top Home Builders – April 2021

A review of the leading home builders in the Sunshine State based on the total number of housing starts on record with HBW during the month of April 2021

Earlier this week, we reviewed permit data for new home construction in Florida, and we found that there were approximately 8,520 new residential construction permits added to the HBW database for the month of April 2021.  Today, we are taking a deeper dive into the same construction data reports to identify the home builders driving new residential construction in five major regions of Florida: Southwest, Tampa, Orlando, Jacksonville, Southeast.

Statewide, there were two mega builders that have and continue to dominate the residential construction market – Both D.R. Horton and Lennar Homes carried nearly 25 percent of all new residential construction activity in Florida last month, having 1,154 and 905 new permits on record with HBW respectively.

Here is a look at the top five builders in each of the Florida regions reviewed based on total housing starts on record with HBW for the one-month period:

Southwest

In the southwestern region of Florida, there were approximately 365 active home builders with new construction activity on record with HBW for the month of April, and the following ranked as the top five for total new permits for the one-month period:

Builder Total Permits  Average Value
1-Lennar Homes 326  $      135,512.00
2-D.R. Horton 249  $      202,835.00
3-Pulte Homes 217  $      192,573.00
4-Taylor Morrison 168  $      183,726.00
5-Neal Communities of SW FL 94  $      252,868.00

Tampa

Last month, there were approximately 225 active home builders with new construction activity on record with HBW for the Tampa area, and the following ranked as the top five for total new permits for the one-month period:

Builder Total Permits  Average Value
1-D.R. Horton 245  $      243,212.00
2-The Villages of Lake Sumter 161  $      296,851.00
3-Lennar Homes 95  $      231,887.00
4-Highland Homes 92  $      235,812.00
5-Meritage Homes 89  $      268,571.00

Orlando

Last month, there were more than 165 active home builders with new construction activity on record with HBW for the Orlando area, and the following ranked as the top five for total new permits for the one-month period:

Builder Total Permits  Average Value
1-D.R. Horton 304  $      250,572.00
2-Lennar Homes 223  $      325,923.00
3-Pulte Homes 80  $      246,168.00
4-Taylor Morrison 63  $      266,774.00
5-Meritage Homes 63  $      238,676.00

Jacksonville

In Jacksonville, there were more than 140 active home builders with new construction activity on record with HBW last month, and the following ranked as the top five for total new permits for the one-month period:

Builder Total Permits  Average Value
1-D.R. Horton 283  $      202,617.00
2-Lennar Homes 230  $      220,543.00
3-KB Homes 131  $      146,316.00
4-Dream Finders Construction 110  $      221,575.00
5-Pulte Homes 82  $      193,376.00

Southeast

Last month, there were approximately 160 active contractors with new residential construction activity on record with HBW for the southeastern region of Florida, and the following ranked as the top five for total new permits for the one-month period:

Builder Total Permits  Average Value
1-GL Building Corp 106  $      447,084.00
2-Holiday Builders 84  $      241,172.00
3-D.R. Horton 73  $      180,407.00
4-Pulte Homes 55  $      331,383.00
5-Kolter Signature Homes 47  $      137,948.00


To gain more information on the builders, homeowners and permits for the construction activity above, check out HBW for your copy of the latest construction data reports. To gain access to the HBW database and receive custom and detailed reports on the latest residential and commercial building activity in Florida, Georgia, Texas, Alabama, and Oklahoma, please contact HBW for details.

Florida Residential Construction Report – April 2021

A review of permit data for new home construction in Florida during the month of April 2021

In Florida, there were approximately 8,520 housing starts with a total construction value in excess of $2.2 billion added to the HBW database last month. 

Top Markets

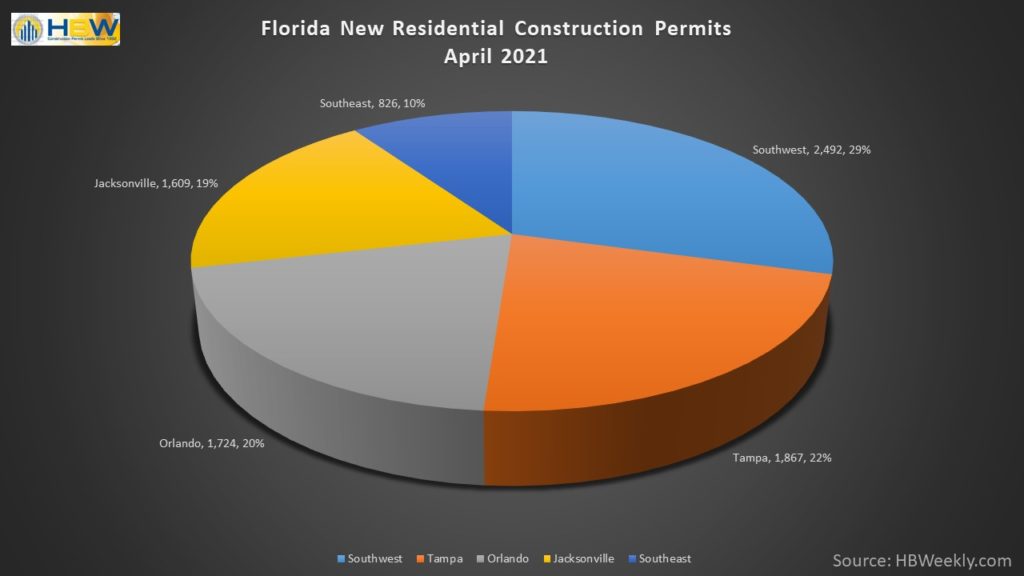
Out of the five regions reviewed (Southwest, Tampa, Orlando, Jacksonville, Southeast), more than half of all housing starts originated from the Southwest and Tampa areas last month where there were 2,492 and 1,867 new residential construction permits added to the HBW database respectively.  Following the Southwest and Tampa, higher concentrations of new home construction could also be found in Orlando (1,724 permits), as well as the Jacksonville area (1,609 permits).

Leading Counties

Out of the five regions reviewed last month, there were several counties that reflected a high volume of new residential construction activity; those counties include Polk County (727 permits) and Pasco County (662 permits) in the Tampa area, and Lee County (646 permits) in the southwestern region.  Additionally, Manatee County (Southwest) and Duval County (Jacksonville) exhibited a higher volume of housing starts in comparison to other counties across the state as there were 599 and 582 new permits on record for the one-month period respectively.

Average Value of Construction

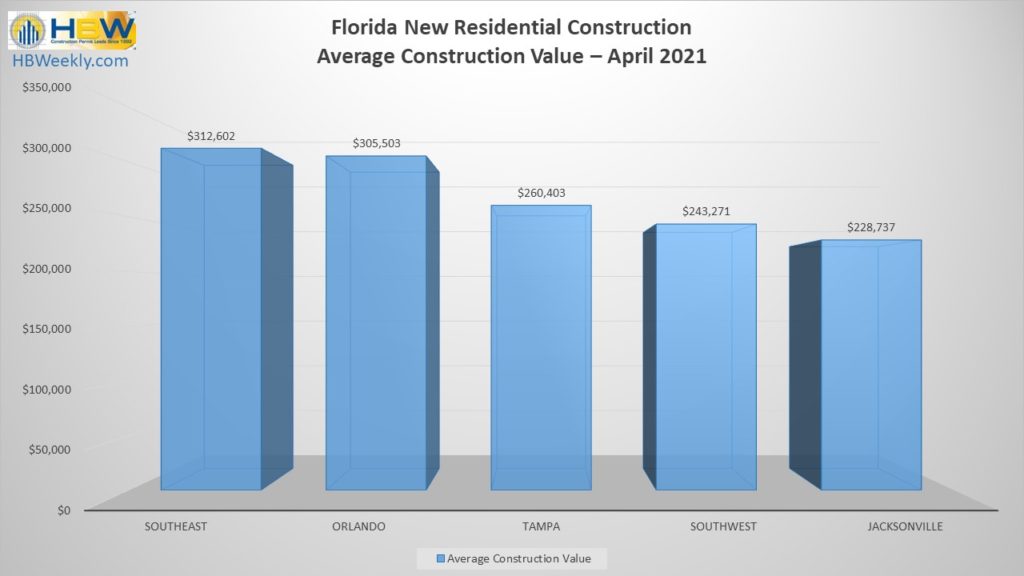
Last month, the average value of new home construction across the Sunshine State ranged from a high of $312,602 (Southeast) to a low of $228,737 (Jacksonville), with the Southeast leading and having the highest average value of new home construction in comparison to other Florida regions reviewed.  Here is a look at the average value of new home construction statewide during the month of April:


To gain more information on the builders, homeowners and permits for the construction activity above, check out HBW for your copy of the latest construction data reports. To gain access to the HBW database and receive custom and detailed reports on the latest residential and commercial building activity in Florida, Georgia, Texas, Alabama, and Oklahoma, please contact HBW for details.

Texas Swimming Pool Construction Review – April 2021

A review of the latest permit data for new swimming pool construction in Texas during the month of April 2021

Last month, there were approximately 1,000 new swimming pool permits with a total construction value of nearly $55.5M added to the HBW database for Texas.  Out of the four metro areas reviewed (Houston, Dallas, Austin, San Antonio), Dallas (477 permits) carried the greatest volume of new pool construction activity, while Austin (average value: $76,346) held the highest average value of new pool construction for the month.

Here is a breakdown of the total permits, average value of construction and leading contractors in each of the four major metro areas of the Lone Star State during the month of April 2021:

Dallas

As previously noted, Dallas ranked #1 for new pool construction having 477 new swimming pool construction permits on record last month.  The average value of new pool construction landed mid-range in Dallas (average value: $46,257) in comparison to other areas reviewed, and the county with the highest concentration of new pool construction activity was Tarrant County (131 permits).

Out of the 170 contractors with new pool construction on record in Dallas last month, the following ranked as the top three for total new permits:

#1 – Puryear Custom Pools

#2 – Hauk Custom Pools

#3 – Claffey Pools

Houston

Last month, Houston ranked #2 for new swimming pool construction, having 414 new permits on record with HBW for the one-month period.  The average value of new pool construction landed on the higher end of the spectrum in Houston (average value: $63,667) in comparison to other Texas areas reviewed, and more than half of all new construction took place in Harris County (252 permits).

Out of the nearly 170 pool contractors with new construction activity on record with HBW in Houston last month, the following ranked as the top three for total new permits:

#1 – Platinum Pools

#2 – McKinney Custom Pools

#3 – Anthony & Sylvan Pools

Austin

For the Austin area, there were more than 80 new swimming pool permits added to the HBW database last month.  The average value of new pool construction was highest in Austin (average value: $76,346) in comparison to other Texas metro areas reviewed, and more than half of all new permits originated from the County of Travis (49 permits).

Out of the 40 contractors with new pool construction in Austin last month, the following ranked as the top three for total new permits on record with HBW:

#1 – Cody Pools

#2 – Anthony & Sylvan Pools

#3 – Majestic Poolscape

San Antonio

Last month, the San Antonio area carried a low level of new pool construction, as well as a low average value of new projects, having 26 new permits on record with HBW for the one-month period.  The average value of new pool construction was $29,897, and nearly all permits originated from Bexar County (20 permits).

Out of the nearly 20 contractors with new pool construction activity on record in San Antonio last month, the following ranked as the top three for total new permits:

#1 – Aquamarine Pools

#2 – Keith Zars Pools

#3 – Cody Pools


To gain more information on the builders, homeowners and permits for the construction activity above, check out HBW for your copy of the latest construction data reports. To gain access to the HBW database and receive custom and detailed reports on the latest residential and commercial building activity in Florida, Georgia, Texas, Alabama, and Oklahoma, please contact HBW for details.

Texas Top Home Builders – April 2021

A review of leading home builders in Texas during the month of April 2021

Last week, we reviewed new residential construction permit data in Texas for the month of April and discovered that there were approximately 7,745 residential construction permits with a total value of nearly $2 billion added to the HBW database for Texas.  This week, we are taking a closer look into HBW’s construction data reports to identify the leading contractors that are driving residential construction in each of the four major metro areas of Dallas, Houston, Austin and San Antonio.

Across the four areas, two home builders have and continue to lead residential construction in terms of housing starts.  Last month, D.R. Horton and Lennar Homes each had 740 and 615 new residential construction permits on record respectively; in addition to landing on the top of the leaderboard in most areas reviewed, they accounted for 18 percent of all new home construction in Texas for the one-month period.

Here is a closer look at the top five home builders for total new permits in Dallas, Houston, Austin and San Antonio during the month of April 2021:

Houston

Last month, there were more than 360 home builders with new construction activity on record with HBW in the Houston area, and the following ranked as the top five for total new permits:

Builder Total Permits
1-Lennar Homes 283
2-D.R. Horton 252
3-K Hovnanian Homes 138
4-Pulte Homes 118
5-Perry Homes 96

Dallas

In Dallas, there were more than 220 contractors with new home construction on record with HBW for the month of April, and the following ranked as the top five for total new permits during the one-month period:

Builder Total Permits
1-D.R. Horton 371
2-First Texas Homes 179
3-Pulte Homes 152
4-Lennar Homes 140
5-Trophy Signature Homes 139

Austin

Last month, there were 85 contractors in Austin with new residential construction on record with HBW, and the following ranked as the top five for total new permits:

Builder Total Permits
1-Lennar Homes 183
2-D.R. Horton 117
3-Pulte Homes 84
4-Brookfield Residential Texas Homes 81
5-Taylor Morrison Homes 64

San Antonio

In San Antonio, there were approximately 75 home builders with new construction activity on record with HBW last month, and the following ranked as the top five for total new permits during the one-month period:

Builder Total Permits
1-Tri Pointe Homes 29
2-Continental Homes of Texas 13
3-Trendmaker Homes 11
4-Bellaire-Hagen 10
5-Bella Vista CMI 10

To gain more information on the builders, homeowners and permits for the construction activity above, check out HBW for your copy of the latest construction data reports. To gain access to the HBW database and receive custom and detailed reports on the latest residential and commercial building activity in Florida, Georgia, Texas, Alabama, and Oklahoma, please contact HBW for details.

HBW Report: Texas Residential Construction – April 2021

A review of new residential construction throughout Texas during the month of April 2021

Based on the latest construction data reports available from HBW, there were approximately 7,745 residential construction permits with a total value of nearly $2 billion added to the HBW database for Texas last month.  Out of the four major Texas metro areas reviewed (Dallas, Houston, Austin, San Antonio), the greatest volume and highest average value of housing starts could be found in the Dallas area where there were 3,263 new permits with an average construction value of nearly $296k for the one-month period.

Here is a closer look at the total permits, construction values and leading counties for new home construction in Texas during the month of April 2021:

Dallas

As noted above, Dallas carried both the greatest volume and highest average value of new home construction in comparison to other Texas areas reviewed last month, having 3,263 new permits with a total construction value in excess of $965.6 million added to the HBW database.  The average value of construction was highest in Dallas (average value: $295,933), and more than half of all new permits originated from the counties of Collin (1,487 permits) and Tarrant (646 permits).

Houston

Last month, Houston ranked #2 for new home construction having 3,090 housing starts with a total construction value in excess of $655 million on record with HBW.  The average value of new residential construction projects was lowest in the Houston area (average value: $212,054) in comparison to other metro areas reviewed, and more than half of all new permits originated from Harris County (1,645 permits).

Austin

In Austin, there were 1,138 housing starts with a total construction value of $294.4 million during the month of April.  The average value of new home construction landed mid-range in Austin (average value: $258,732) in comparison to other Texas areas reviewed, and the majority of all new construction took place in the two counties of Travis and Williamson where there were 538 and 435 new permits respectively.

San Antonio

Last month, there were just over 250 housing starts with a total construction value of approximately $73.5 million in San Antonio.  The average value of new home construction landed on the higher end of the spectrum (average value: $291,623) in comparison to other metro areas reviewed, and more than half of all new construction took place in Bexar County where there were 131 permits on record for the one-month period.


To gain more information on the builders, homeowners and permits for the construction activity above, check out HBW for your copy of the latest construction data reports. To gain access to the HBW database and receive custom and detailed reports on the latest residential and commercial building activity in Florida, Georgia, Texas, Alabama, and Oklahoma, please contact HBW for details.

HBW Quarterly: Florida Swimming Pool Construction Q1-2021

A review of permit data on record with HBW for new swimming pool construction in Florida during the first quarter of 2021

Since the start of this year (thru March 2021), there have been 10,040 new swimming pool permits added to the HBW database for Florida, reflecting a 41 percent increase in new pool construction in comparison to the same time last year.  In HBW’s “Swimming Pool Construction Activity Trend Report”, six major Florida regions were reviewed (Central, West, Southeast, Southwest, Northeast, Northwest), all of which exhibited year-over-year increases in new pool construction activity ranging from 17 percent to 61 percent; out of those regions, nearly half of all new swimming pool construction activity could be found in the southwest and southeast regions where there were 2,985 and 1,882 new permits on record for the three-month period respectively.

Here is a closer look at the total permits and leading counties for new pool construction throughout the Sunshine State from January through March of this year:

Southwest Florida

Total Permits thru Q1-2021: 2,985 permits

% Change in Permits (YTD – 2020 vs. 2021): +52 percent

Leading County for Total Permits: Lee County (928 permits)

Southeast Florida

Total Permits thru Q1-2021: 1,882 permits

% Change in Permits (YTD – 2020 vs. 2021): +61 percent

Leading County for Total Permits: Palm Beach County (734 permits)

West Florida

Total Permits thru Q1-2021: 1,786 permits

% Change in Permits (YTD – 2020 vs. 2021): +37 percent

Leading County for Total Permits: Pasco County (512 permits)

Central Florida

Total Permits thru Q1-2021: 1,462 permits

% Change in Permits (YTD – 2020 vs. 2021): +17 percent

Leading County for Total Permits: Orange County (537 permits)

Northeast Florida

Total Permits thru Q1-2021: 1,045 permits

% Change in Permits (YTD – 2020 vs. 2021): +47 percent

Leading County for Total Permits: St. Johns County (386 permits)

Northwest Florida

Total Permits thru Q1-2021: 880 permits

% Change in Permits (YTD – 2020 vs. 2021): +26 percent

Leading County for Total Permits: Santa Rosa County (171 permits)

To gain more information on the builders, homeowners and permits for the construction activity above, check out HBW for your copy of the latest construction data reports. To gain access to the HBW database and receive custom and detailed reports on the latest residential and commercial building activity in Florida, Georgia, Texas, Alabama, and Oklahoma, please contact HBW for details.

HBW Report: Florida Residential Construction Q1-2021

A review of permit data for new home construction in Florida from January through March 2021

Florida’s residential construction market is off to a very strong start in the first quarter of this year.  From January through March, there have been approximately 31,150 housing starts recorded by HBW, reflecting a 30 percent increase in comparison to the same time last year.  Across all regions reviewed, there have been significant spikes in the new home construction ranging from 12 percent to more than 48 percent.  Out of the six regions reviewed (Northeast, Northwest, Central, Southwest, Southeast, West), the greatest volume new home construction could be found in West Florida (7,268 permits), while the greatest year-over-year growth is evident in the northeast where there was more than a 48 percent increase in new permits in comparison to the same time last year.

Here is a breakdown of the total permits, leading counties and year-over-year growth in each of the six Florida regions listed in the latest HBW Building Activity Trend Report for new residential construction in the Sunshine State:

West

As previously noted, the western region of Florida held the highest volume of housing starts in the first quarter of this year; the region experienced a 28 percent increase in new home construction in comparison to the same time last year, resulting in 7,268 new permits on record with HBW.  Out of the seven counties reviewed in the area, the greatest amount of new home construction activity could be found in Polk County and Pasco County where there were 2,630 and 2,302 permits respectively for the three-month period.

Southwest

In the first quarter of this year, there have been 6,522 housing starts in the southwestern region of Florida, reflecting a 35 percent increase in new home construction in comparison to the same time last year.  Out of the five counties that make up the area, the greatest concentration of new home construction activity could be found in Lee County where there was a 35 percent year-over-year increase in housing starts resulting in approximately 2,130 new permits on record.

Northeast

As previously noted, new home construction is on the rise in the northeastern region of Florida; since the start of this year (thru March), there have been 5,753 housing starts recorded for the area which is indicative of more than a 48 percent year-over-year increase in new home construction activity.  Out of the eight counties that make up the region, more than half of all new permits originated from St. Johns (1,587 permits) and Duval (1,403 permits).

Central

In Q1-2021, there have been 4,530 housing starts in the Central Florida region, reflecting a 26 percent year-over-year increase in new home construction.  Out of the six counties that make up Central Florida, more than half of all new permits originated from the two counties of Orange and Volusia where there were 1,284 and 1,209 new permits respectively for the three-month period.

Northwest

From January through March of this year there have been 3,772 housing starts recorded for the northwestern region of Florida, reflecting a 12 percent increase in new home construction in comparison to the same time last year.  The regional report for the northwest included 16 Florida counties, in addition to two counties along the Alabama border; out of the 18 counties reviewed, the highest concentration of new home construction could be found in Baldwin, AL and Bay, FL where there were 908 and 597 housing starts respectively.

Southeast

Since the start of this year (thru March) there have been more than 3,300 housing starts in the southeastern region of Florida, reflecting a 26 percent year-over-year increase in new home construction.  Out of the seven counties that make up the region, St. Lucie County and Palm Beach County carried the greatest volume of new home construction having 1,376 and 929 new permits on record with HBW respectively.

To gain more information on the builders, homeowners and permits for the construction activity above, check out HBW for your copy of the latest construction data reports. To gain access to the HBW database and receive custom and detailed reports on the latest residential and commercial building activity in Florida, Georgia, Texas, Alabama, and Oklahoma, please contact HBW for details.

Texas Swimming Pool Construction Review: Q1-2021

A review of permit data for new swimming pool construction in Texas from January through March 2021

Since the start of this year, new swimming pool construction has been on the rise in most of the major metro regions of Texas.  In the first quarter of 2021, there have been 3,270 new swimming pool construction permits recorded in the HBW database from the combined areas of Dallas, Houston, Austin and San Antonio; this reflects a 59 percent increase in new pool construction in comparison to the same time last year.

Nearly all areas reviewed (with the exception of San Antonio) have demonstrated impressive increases in new pool construction activity, with year-over-year increases ranging from 18 percent (Austin) to 75 percent (Houston).

Here is a closer look at the total permits and leading counties for new swimming pool construction in Dallas, Houston, Austin and San Antonio during Q1-2021:

Dallas

In the first quarter of this year, Dallas ranked #1 for new swimming pool construction, having experienced a 73 percent year-over-year increase in pool construction, resulting in 1,646 new permits on record with HBW for the three-month period.  Out of the six counties reviewed in the Dallas area, the greatest concentration of new pool construction activity could be found in Collin County where there were more than 545 pool starts that resulted from a 100+ percent year-over-year increase in new swimming pool construction.

Houston

The Houston area demonstrated the greatest year-over-year increase in new swimming pool construction (+75%) which resulted in nearly 1,115 new permits on record with HBW in Q1-2021.  Out of the five counties reviewed in the Houston area, the greatest volume of new swimming pool construction could be found in Harris County where there was a 63 percent year-over-year increase resulting in approximately 670 new swimming pool construction permits on record for the three-month period.

Austin

In the first quarter of this year, new swimming pool construction in the Austin area was ahead of last year’s figures by 18 percent, resulting in more than 350 new pool permits on record with HBW.  Out of the four counties reviewed, well more than half of all pool starts took place in Travis County where there were 215 new permits on record for the three-month period.

San Antonio

As previously noted, San Antonio was the only metro area that appears to be off to a slow start so far this year.  From January through March there have been approximately 160 new swimming pool construction permits that have originated from San Antonio, reflecting a 12 percent decline in comparison to the same time last year.  Out of the three counties reviewed, just over half of all new pool construction activity took place in Bexar County where there were 83 new swimming pool construction permits in the first quarter of this year.


To gain more information on the builders, homeowners and permits for the construction activity above, check out HBW for your copy of the latest construction data reports. To gain access to the HBW database and receive custom and detailed reports on the latest residential and commercial building activity in Florida, Georgia, Texas, Alabama, and Oklahoma, please contact HBW for details.