A review of permit data for new residential construction in the Lone Star State during the month of June
Earlier this week, we reviewed the latest HBW construction data reports to highlight swimming pool construction activity in Texas during the month of June; today, we have gathered new construction data reports for the purpose of reviewing residential construction activity in Texas.
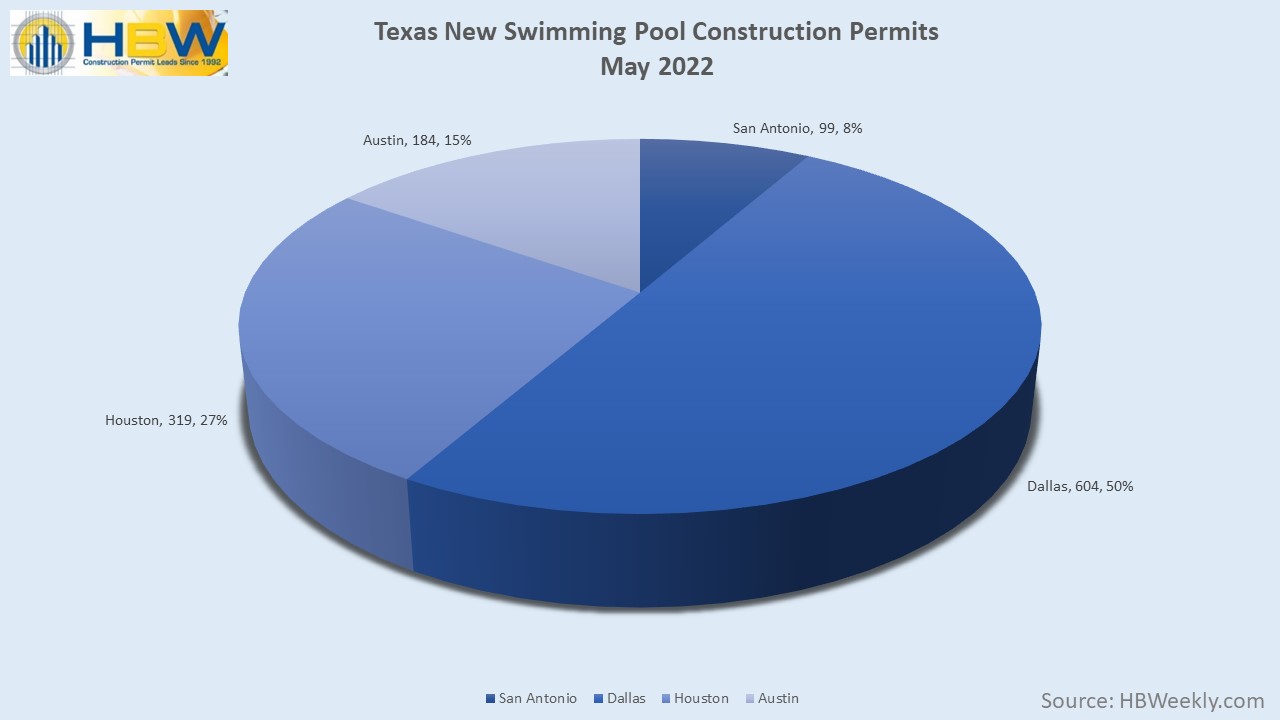
Based on the latest HBW reports, there were approximately 7,220 new residential construction permits with a total value of nearly $2.1 billion in the Lone Star State last month. Out of the four major metro areas that were included in the report (Houston, Dallas, San Antonio, Austin), Dallas ranked #1 for new home construction (3,049 permits), while the highest average value of new home construction could be found in Austin (average value: $335,436)
Here is a look at the new residential construction permit data on record with HBW for each of the four major metro areas in Texas during the month of June 2022:
Dallas
As noted above, Dallas ranked #1 for new home construction last month, having approximately 3,050 new permits with a total construction value in excess of $980.6 million. The average value of new home construction landed on the higher end of the spectrum (average value: $321,615) in relation to the other areas reviewed, and more than half of all new home construction activity took place in the two counties of Collin (941 permits) and Tarrant (672 permits).
Houston
Not far behind Dallas, the Houston area ranked #2 for new home construction last month, having 2,914 new permits with a total construction value in excess of $741.3 million. The average value of new residential construction projects was $254,406, and the bulk of all new permits originated from the two counties of Harris (1,283 permits) and Montgomery (737 permits).
Austin
In Austin, there were more than 690 new residential construction permits with a total value of approximately $232 million on record last month. The average value of new home construction was highest in the Austin area (average value: $335,436) in comparison to other Texas regions reviewed, and nearly all permits originated from the two counties of Travis (285 permits) and Williamson (268 permits).
San Antonio
Last month, there were approximately 565 new residential construction permits with a total value of nearly $134.2 million on record for San Antonio. The average value of new home construction was lowest in San Antonio (average value: $238,301) in comparison to other Texas regions reviewed, and more than half of all new permits originated from the County of Bexar (354 permits).
To gain more information on the builders, homeowners and permits for the construction activity above, check out HBW for your copy of the latest construction data reports. To gain access to the HBW database and receive custom and detailed reports on the latest residential and commercial building activity in Florida, Georgia, Texas, Alabama, and Oklahoma, please contact HBW for details.