Texas Swimming Pool Construction Review – October 2020

An overview of the latest permit data for new swimming pool construction in Texas during the month of October 2020

Based on the latest construction data report from HBW, there were 900 pool starts with a total construction value of nearly $45.3 million in Texas last month.  Out of the four major metropolitan areas reviewed (Dallas, Houston, Austin, San Antonio), the greatest volume of new swimming pool construction permits could be found in Dallas (428 permits), while the highest average value of construction took place in the Houston area (average value: $61,972).

Here is a closer look at the total permits, average value of construction and leading counties for new swimming pool construction in Texas during the month of October 2020:

Dallas

In Dallas, there were 428 pool starts with a total construction value of approximately $17.7 million last month.  The average value of new pool construction was on the lower end of the spectrum (average value: $41,352) in comparison to other areas reviewed, and the county with the greatest amount of new pool construction activity was Collin County (142 permits).

Out of the 150 contractors with new swimming pool construction activity on record in the Dallas area last month, the following ranked as the top three for total new permits:

Builder Total Permits
1-Riverbend Pools 25
2-Foley Custom Pools 16
3-Prestige Pool 16

Houston

Last month, there were 310 pool starts with a total construction value in excess of $19.2 million in the Houston area.  The average value of new pool construction was highest in Houston (average value: $61,972) in comparison to other Texas metro areas reviewed, and the majority of new permits originated from Harris County (199 permits).

Out of the 135 pool builders with new permits on record with HBW last month, the following ranked as the top three for total new permits:

Builder Total Permits
1-Platinum Pools 24
2-Premier Pools 24
3-Cypress Custom Pools 17

Austin

In Austin, there were more than 110 pool starts with a total construction value of approximately $6.7 million during the month of October.  The average value of new pool construction landed on the higher end of the spectrum in the Austin area (average value: $60,087) in comparison to other areas reviewed, and the county with the highest concentration of new pool construction was Travis County with more than 75 new permits for the one-month period.

Out of the 55 pool contractors with new construction activity on record with HBW last month, the following ranked as the top three for total new permits:

Builder Total Permits
1-Anthony & Sylvan Pools 11
2-Cody Pools 11
3-Premier Pools & Spas of Austin 7

San Antonio

Last month, there were more than 50 pool starts with a total construction value of nearly $1.7 million in San Antonio.  The average value of new pool construction was lowest in San Antonio (average value: $32,956) in comparison to other areas reviewed, and the majority of all new construction took place in Bexar County (38 permits).

Out of the approximately 25 pool contractors with new construction activity on record in the San Antonio area last month, the following ranked as the top three for total new permits:

Builder Total Permits
1-Keith Zars Pools 9
2-Cody Pools 6
3-Texas Pools & Patios 3


To gain more information on the builders, homeowners and permits for the construction activity above, check out HBW for your copy of the latest construction data reports. To gain access to the HBW database and receive custom and detailed reports on the latest residential and commercial building activity in Florida, Georgia, Texas, Alabama, and Oklahoma, please contact HBW for details.

Texas Top Home Builders – October 2020

A review of the leading home builders in the four major metropolitan areas of Texas during the month of October 2020

As reported earlier this week in the previous post entitled “Texas Residential Construction Review – October 2020”, there were more than 7,300 housing starts with a total construction value of $1.7 billion on record with HBW for the Lone Star State last month. While we took a look at the total number of permits and leading areas for new home construction in the earlier post, today we are taking a deeper dive into the latest construction permit data to identify leading contractors driving the market within each of the four major metropolitan areas of Texas (Houston, Dallas, Austin, San Antonio).

Statewide, D.R. Horton continues to have a major hold on new home construction, with approximately 1,000 housing starts in October and carrying the greatest amount of new residential construction permits in three out four of the regions reviewed.  Next in line, Lennar Homes was ranked #1 in San Antonio last month and had more than 500 housing starts from all metropolitan areas combined.

Based on the latest HBW construction data reports, the leading contractors in each of the four metro areas of Texas during the month of October 2020 are as follows:

Houston

There were more than 330 contractors with new residential construction activity on record in the Houston area last month, and the following ranked as the top five for total new permits:

Builder Total Permits
1-D.R. Horton 520
2-Lennar Homes 273
3-K Hovnanian Homes 196
4-Camillo Properties 186
5-Perry Homes 176

Dallas

Out of the nearly 230 home builders with new residential construction activity on record in the Dallas area last month, the following ranked as the top five for total new permits for the one-month period:

Builder Total Permits
1-D.R. Horton 305
2-Bloomfield Homes 147
3-Highland Homes 84
4-Lennar Homes 75
5-Meritage Homes 72

Austin

In Austin, there were approximately 90 contractors with housing starts on record last month, and the following ranked as the top five for total new permits for the one-month period:

Builder Total Permits
1-D.R. Horton 129
2-KB Homes 109
3-Lennar Homes 101
4-Meritage Homes 58
5-Pacesetter Homes 54

San Antonio

Out of the 95 home builders with new permitting activity on record in San Antonio last month, the following ranked as the top five for total new permits:

Builder Total Permits
1-Lennar Homes 57
2-Continental Homes of Texas 46
3-D.R. Horton 45
4-Meritage Homes 44
5-KB Homes 35


To gain more information on the builders, homeowners and permits for the construction activity above, check out HBW for your copy of the latest construction data reports. To gain access to the HBW database and receive custom and detailed reports on the latest residential and commercial building activity in Florida, Georgia, Texas, Alabama, and Oklahoma, please contact HBW for details.

Texas Residential Construction Review – October 2020

A review of residential construction permits added to the HBW database during the month of October 2020 for the State of Texas

Last month, there were more than 7,300 new residential construction permits with a total construction value of approximately $1.7 billion added to the HBW database for the Lone Star State, reflecting a 6 percent month-over-month decrease in new home construction activity.  Out of the four major metropolitan areas included in the report (Dallas, Houston, Austin, San Antonio), the greatest concentration of new home construction activity could be found in the Houston area (3,509 permits), while the highest average value of new residential construction projects remained in Dallas (average value: $272,926).

Here is a detailed look at the total permits, average value of construction and leading counties for new residential construction in Texas during the month of October 2020:

Houston

Total Permits: 3,509

Total Construction Value: $675.3 million

Average Value of Construction: $192,450

Leading Counties (based on total new permits):  Harris County (1,769 permits), Montgomery County (798 permits)

Dallas

Total Permits: 2,186

Total Construction Value: $597 million

Average Value of Construction: $272,926

Leading Counties (based on total new permits): Tarrant County (768 permits), Collin County (506 permits)

Austin

Total Permits: 1,042

Total Construction Value: $247.2 million

Average Value of Construction: $237,229

Leading Counties (based on total new permits): Travis County (573 permits), Williamson County (314 permits)

San Antonio

Total Permits: 569

Total Construction Value: $137.8 million

Average Value of Construction: $242,176

Leading County (based on total new permits): Bexar County (405 permits)


To gain more information on the builders, homeowners and permits for the construction activity above, check out HBW for your copy of the latest construction data reports. To gain access to the HBW database and receive custom and detailed reports on the latest residential and commercial building activity in Florida, Georgia, Texas, Alabama, and Oklahoma, please contact HBW for details.

HBW Quarterly Report: Florida Swimming Pool Construction

A review of the latest permit data for new swimming pool construction across Florida through Q3-2020

In Florida, there were 23,508 new swimming pool construction permits added to the HBW database from January through September of this year, reflecting a 21 percent year-over-year increase in pool starts. 

While new swimming pool construction has been on the rise in Florida for several years, the gains exhibited so far this year are the highest since 2005.  Additionally, the growth is not just limited to specific areas; rather all six regions included in the report (Central, West, Southeast, Southwest, Northeast, Northwest) have demonstrated year-over-year gains in new pool construction ranging from 12 percent to 28 percent.

Here is a closer look at new swimming pool construction permit details as recorded by HBW for Florida through the third quarter of this year:

Southwest

Out of the six regions reviewed, the southwest carried the highest volume of pool starts, with nearly 6,400 new swimming pool construction permits on record through Q3-2020.  The area has demonstrated a 21 percent gain in new pool construction since the start of this year, and more than half of all new permits originated from the counties of Lee (2,158 permits) and Sarasota (1,321) where new pool construction is up since last year by 36 percent and 26 percent respectively.

Southeast

In the southeastern region of Florida, there have been more than 4,300 pool starts since the start of this year through September, reflecting a 24 percent year-over-year increase in new swimming pool construction.  Out of the seven counties that make up the southeast, well more than half of all new pool construction took place in the two counties of Palm Beach (1,580 permits) and Miami-Dade (1,280 permits) where there have been year-over-year increases in permits of 42 percent and 31 percent respectively.

West

Through the third quarter of this year, there have been 4,265 pool starts in the western region of Florida, reflecting a 12 percent year-over-year increase in new swimming pool construction.  Out of the seven counties reviewed in the area, more than half of all new construction activity could be found in the two counties of Hillsborough (1,221 permits) and Pasco (1,009 permits) where there have been year-over-year increases in new permits ranging from 3 to 30 percent respectively.

Central

In Central Florida, there have been nearly 3,730 new swimming pool construction permits added to the HBW database through the third quarter of this year, reflecting a 28 percent year-over-year increase in pool starts.  Out of the six counties reviewed in the area, Orange County held the greatest concentration of new swimming pool construction activity, with an 18 percent year-over-year increase in new pool construction that resulted in more than 1,300 new permits on record.

Northwest

Since the start of this year (thru Q3), there have been approximately 2,410 pool starts in the northwestern region of Florida, reflecting a 21 percent year-over-year increase in new pool construction.  Out of the 18 counties reviewed and factored into the report for the area, the highest concentration of new construction activity could be found in Santa Rosa County, where there has been a 16 percent year-over-year increase in pool starts, resulting in nearly 485 new permits through the third quarter of this year.

Northeast

In the northeastern region of Florida, there has been a 24 percent year-over-year increase in new swimming pool construction, resulting in nearly 2,410 new permits on record with HBW through the third quarter of this year.  Out of the eight counties reviewed in the area, the bulk of new construction activity could be found in St. Johns (951 permits) and Duval (550 permits), where there have been year-over-year increases in pool starts ranging from 9 percent (Duval) to 47 percent (St. Johns).

To gain more information on the builders, homeowners and permits for the construction activity above, check out HBW for your copy of the latest construction data reports. To gain access to the HBW database and receive custom and detailed reports on the latest residential and commercial building activity in Florida, Georgia, Texas, Alabama, and Oklahoma, please contact HBW for details.
Florida Residential Construction Quarterly Review: Q3-2020

A review of permit data for new residential construction in Florida through Q3-2020

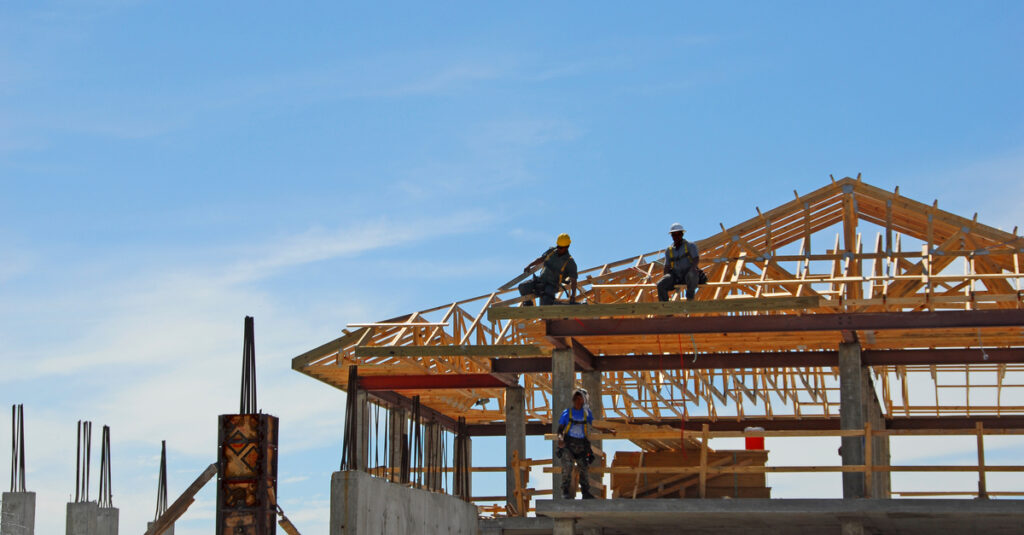
Since the start of this year (thru Q3-2020), Florida has experienced a 12 percent year-over-year increase in housing starts, resulting in approximately 70,650 new residential construction permits added to the HBW database.  Out of the six Florida regions reviewed (Southwest, Southeast, Northwest, Northeast, West, Central), all areas have experienced year-over-year gains in new home construction ranging from 3 percent (Southeast) to 21 percent (Northwest), and nearly 60 percent of all new permits statewide originated from the three regions of West (15,937 permits), Southwest (12,902 permits), and Northeast (12,647 permits) Florida.

Here is a closer look at the total permits, leading counties and year-over-year growth in new residential construction in each of the six Florida regions reviewed through the third quarter of this year:

West

Out of the six regions reviewed, the greatest concentration of housing starts could be found in the western region of Florida where there has been a 4 percent year-over-year increase in new home construction, resulting in 15,937 new permits on record with HBW.  The counties with the highest level of new home construction activity include: Polk (4,920 permits); Hillsborough (4,315 permits); and Pasco (3,281 permits).

Southwest

In the southwestern region of Florida, there has been an 11 percent year-over-year increase in new home construction since the start of this year (thru Q3-2020), resulting in more than 12,900 new permits on record with HBW.  Out of the five counties reviewed in the area, the highest concentration of housing starts originated from Lee County (4,243 permits) where there has already been a 26 percent year-over-year increase in new permitting activity through the third quarter of this year.

Northeast

Since the start of this year (thru Q3-2020), the northeast region of Florida has experienced a 17 percent year-over-year increase in new residential construction, resulting in nearly 12,650 new permits.  Out of the eight counties that make up the northeast region, more than half of all new construction activity took place in the two counties of Duval (4,261 permits) and St. Johns (3,341 permits), where there were year-over-year increases in housing starts of 30 percent and 6 percent respectively.

Central

In Central Florida, there has been a 16 percent year-over-year increase in new home construction so far this year, resulting in more than 11,540 new permits on record with HBW.  Out of the six counties reviewed, the greatest concentration of new housing starts could be found in the counties of Orange (3,673 permits) and Lake (2,002 permits).

Northwest

Through the third quarter of this year, the northwestern region of Florida has demonstrated the greatest percentage of annual growth in the market, having approximately 10,010 housing starts with a 21 percent year-over-year increase in new residential construction permits.  Out of the eighteen counties reviewed (inclusive of bordering counties in Alabama), the majority of all new home construction took place in the four counties of Baldwin, AL (2,265 permits), Santa Rosa (1,776 permits), Escambia (1,462 permits) and Bay (1,151 permits).

Southeast

In the southeastern region of Florida, there has been a 3 percent year-over-year increase in housing starts through the third quarter of this year, resulting in 7,613 new residential construction permits on record with HBW.  Out of the seven counties reviewed, more than half of all new permits originated from the two counties of St. Lucie (3,002 permits) and Palm Beach (1,888 permits).


To gain more information on the builders, homeowners and permits for the construction activity above, check out HBW for your copy of the latest construction data reports. To gain access to the HBW database and receive custom and detailed reports on the latest residential and commercial building activity in Florida, Georgia, Texas, Alabama, and Oklahoma, please contact HBW for details.
Florida Swimming Pool Construction Review – September 2020

A report on the latest construction data for new swimming pool permits on record for Florida during the month of September 2020

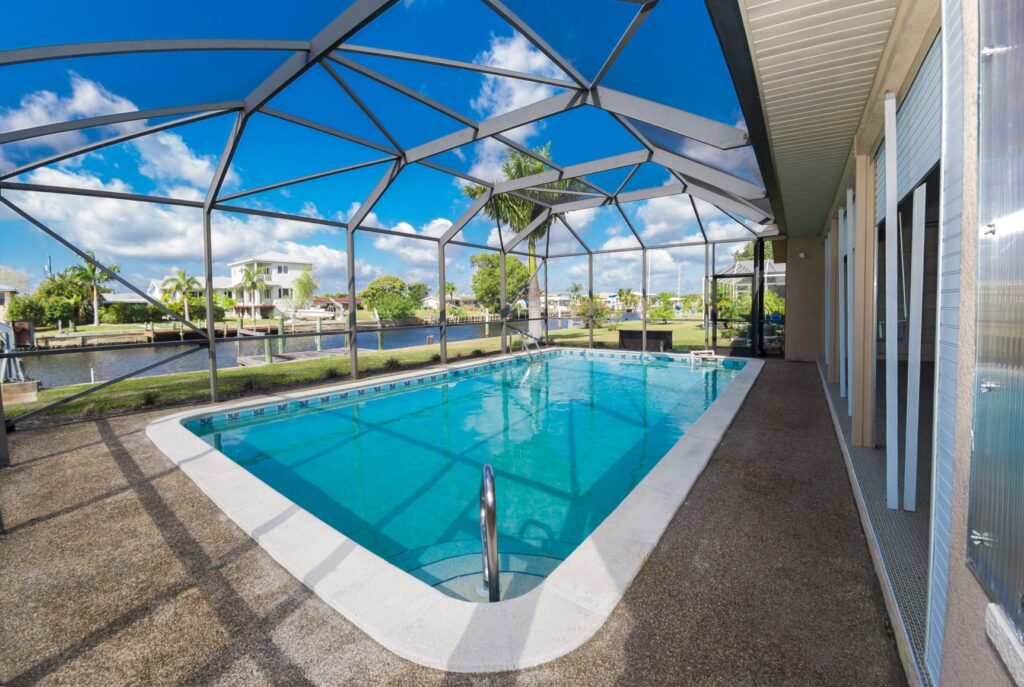
During the month of September, there were approximately 2,620 new swimming pool permits with a total construction value of nearly $121.5 million added to the HBW database for the Sunshine State.  HBW’s monthly construction data reports covered the five major regions of Florida (Southwest, Tampa, Orlando, Southeast, Jacksonville) and included details such as total permits and value of construction by area and contractor.

Here is a closer look at permit data for new swimming pool construction in each Florida region during the month of September 2020:

Southwest

The highest concentration of new swimming pool construction could be found in the southwestern region of Florida, where there were more than 840 pool starts with a total construction value of approximately $39 million.  The average value of new pool construction landed mid-range (average value: $46,299) in comparison to other Florida regions reviewed, and nearly half of all new permits originated from the counties of Lee (235 permits) and Manatee (183 permits).

Out of the 150 pool contractors with new construction activity in the area last month, the following ranked as the top three for total new permits:

Builder Total Permits
1-Coast to Coast Pools 93
2-Aragon Pools & Spas 59
3-Pinnacle USA 38

Southeast

In the southeastern region of Florida, there were 565 pool starts with a total construction value of approximately $23.1 million last month.  The average value of new swimming pool construction was lowest in the southeast (average value: $40,857) in comparison to other Florida areas reviewed, and the majority of all new permits on record originated from the counties of Palm Beach (193 permits) and Miami-Dade (170 permits).

Out of the nearly 180 contractors with new construction activity on record for the one-month period, the following ranked as the top three for total new permits:

Builder Total Permits
1-A&G Concrete Pools 26
2-Fountain Blue Pool Svc 20
3-Champion Pools & Spas 19

Tampa

Last month, there were 555 pool starts with a total construction value in excess of $28.8 million in the Tampa area.  The average value of new swimming pool construction landed on the higher end of the spectrum (average value: $51,946) in comparison to other Florida regions reviewed, and the bulk of new pool construction activity took place in the counties of Hillsborough (177 permits) and Pasco (163 permits).

Out of the nearly 135 contractors with new swimming pool construction activity on record last month, the following ranked as the top three for total new permits:

Builder Total Permits
1-Olympus Pools 63
2-Challenger Pools 35
3-Gulfstream Pools & Spas 31

Orlando

In the Orlando area, there were approximately 425 new swimming pool permits with a total construction value in excess of $18 million last month.  The average value of new swimming pool construction was $42,655, and more than half of all new construction took place in in the two counties of Orange (123 permits) and Brevard (108 permits)

Out of the nearly 110 contractors with new construction activity on record in the Orlando area last month, the following ranked as the top three for total new permits:

Builder Total Permits
1-Bobs Pool Service 35
2-Martin Pools 30
3-All Seasons 28

Jacksonville

Last month, there were approximately 235 pool starts with a total construction value of $12.5 million in the Jacksonville area.  The average value of new swimming pool construction was highest in Jacksonville (average value: $53,474) in comparison to other Florida regions, and the majority of all new permits originated from the counties of St. Johns (110 permits) and Duval (58 permits).

Out of the nearly 80 pool contractors with new construction on record last month, the following ranked as the top three for total new permits:

Builder Total Permits
1-Pools by John Clarkson 14
2-Blue Haven Pools 13
3-Michael L. Mullins Construction 11

To gain more information on the builders, homeowners and permits for the construction activity above, check out HBW for your copy of the latest construction data reports. To gain access to the HBW database and receive custom and detailed reports on the latest residential and commercial building activity in Florida, Georgia, Texas, Alabama, and Oklahoma, please contact HBW for details.

HBW Report: Florida New Home Construction Review – September 2020

A review of the latest permit data for new residential construction in Florida during the month of September 2020

Last month, there were approximately 6,870 housing start with a total construction value in excess of $1.8B in the Sunshine State.  Out of the five regions reviewed (Orlando, Tampa, Southwest, Southeast, Jacksonville), Tampa (2,188 permits) carried the greatest volume of new residential construction activity, while the highest average value of new home construction could be found in the Orlando area (average value: $304,281).

Here is a closer look at the new residential construction data on record with HBW for Florida during the month of September 2020:

Tampa

As previously mentioned, the Tampa carried the highest volume of new home construction last month, having nearly 2,190 new permits with a total construction value greater than $607.3 million on record with HBW.  The average value of new home construction in Tampa (average value: $277,581) landed on the higher end of the spectrum in comparison to other Florida regions reviewed, and the bulk of new permits originated from the two counties of Pasco (831 permits) and Polk (717 permits).

Southwest

In the southwestern region of Florida, there were 1,490 housing starts with a total construction value of nearly $354.5 million last month.  The average value of new home construction was $237,901, and more than half of all new residential construction permits on record for the one-month period originated from the counties of Lee (441 permits) and Manatee (346 permits).

Orlando

Last month, there were 1,250 housing starts with a total construction value of approximately $380.4 million in the Orlando area.  The average value of new home construction was highest in Orlando (average value: $304,281) in comparison to other Florida regions reviewed, and the county with the greatest concentration of housing starts was Orange County, with 322 new residential construction permits on record for the one-month period.

Jacksonville

In Jacksonville, there were approximately 1,110 housing starts with a total construction value in excess of $232 million last month.  The average value of new home construction was lowest in Jacksonville (average value: $209,263) in comparison to other regions reviewed, and the majority of new permits originated from the two counties of Duval (525 permits) and St. Johns (288 permits).

Southeast

Last month, the southeastern region of Florida had 830 housing starts with a total construction value greater than $243 million added to the HBW database.  The average value of new home construction landed on the higher end of the spectrum (average value: $292,841) in comparison to other Florida regions reviewed, and the county with the greatest concentration of new home construction activity was St. Lucie County (318 permits).

To gain more information on the builders, homeowners and permits for the construction activity above, check out HBW for your copy of the latest construction data reports. To gain access to the HBW database and receive custom and detailed reports on the latest residential and commercial building activity in Florida, Georgia, Texas, Alabama, and Oklahoma, please contact HBW for details.

Texas Swimming Pool Construction Quarterly Review: Q3-2020

A report on the permit data for new swimming pool construction in Texas from January through September 2020

According to the latest Swimming Pool Construction Activity Trend Report released by HBW, new swimming pool construction is on the rise in the Lone Star State.  From January through September of this year, there have been approximately 8,315 new swimming pool construction permits added to the HBW database, reflecting a 23 percent year-over-year increase in pool starts.

All major metropolitan areas included in the report (Dallas, Houston, Austin, San Antonio) have experienced significant year-over-year increases in new pool construction (thru Q3-2020), ranging from 16 percent to 33 percent, and more than 80 percent of all new swimming pool construction permits on record throughout the state originated from Dallas (3,890 permits) and Houston (2,798 permits).

Here is a closer look at the total number of new swimming pool construction permits and leading counties by Texas metro area through the third quarter of this year:

Dallas

In Dallas, there have been 3,890 pool starts through Q3-2020, reflecting an 18 percent year-over-year increase in new swimming pool construction.  Out of the six counties reviewed, well over half of all new permits originated from the counties of Collin (1,104 permits) and Tarrant (1,034), where there have been year-over-year increases in new pool construction of 45 percent and 29 percent respectively.

Houston

Through the third quarter of this year there have been 2,798 new swimming pool construction permits added to the HBW database for the Houston area, reflecting an impressive 33 percent year-over-year increase in pool starts.  Out of the five counties that make up the Houston area, the majority of all new pool construction took place in Harris County (1,645 permits) where there has been a 27 percent year-over-year increase in new permitting activity.

Austin

Since the start of this year (thru Q3-2020), there have been approximately 980 pool starts in the Austin area, reflecting a 16 percent year-over-year increase in new swimming pool construction activity.  Out of the four counties reviewed, the bulk of new permits could be found in Travis County (678 permits) where there has been a 5 percent year-over-year increase in new pool construction.

San Antonio

Although the San Antonio area holds the fewest new swimming pool construction permits out of the four regions reviewed, pool starts have been on the rise annually for more than five years.  So far this year there has been a 21 percent year-over-year increase in pool starts, resulting in nearly 650 new permits on record with HBW through Q3-2020.  Nearly all new construction took place in Bexar County (453 permits) where there has been an 8 percent increase in pool starts in comparison to the same time last year.

To gain more information on the builders, homeowners and permits for the construction activity above, check out HBW for your copy of the latest construction data reports. To gain access to the HBW database and receive custom and detailed reports on the latest residential and commercial building activity in Florida, Georgia, Texas, Alabama, and Oklahoma, please contact HBW for details.
Texas Top Home Builders – September 2020

A review of leading residential construction contractors in Texas based on new permits on record with HBW during the month of September 2020

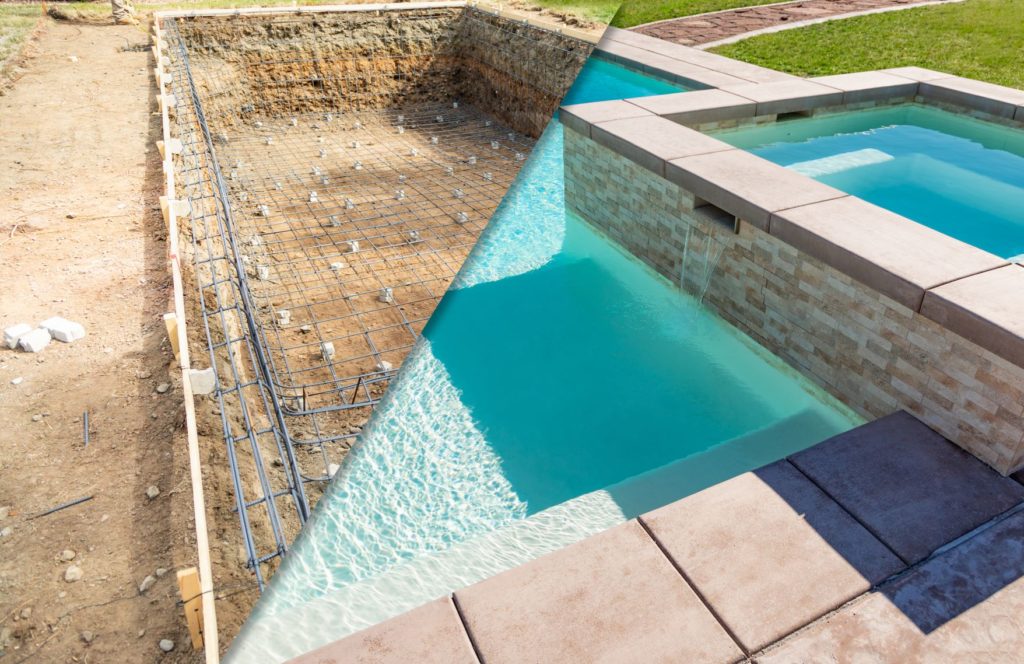
Last month, there were 7,785 housing starts with a total construction value in excess of $1.7 billion in the Lone Star State.  Out of the four major metropolitan areas factored into the total (Dallas, Houston, Austin, San Antonio), Houston carried the highest concentration of new home construction activity (3,881 permits), while the higher value properties continued to thrive in Dallas where the average value of new home construction was $269,916.

Diving deeper into HBW’s monthly construction data reports, several home builders were identified as leading new construction across the state – Based on the total new permits on record with HBW for the one-month period, both D.R. Horton and Lennar Homes continue to dominate the market, having 1,319 and 527 housing starts respectively.

Here is a closer look at the leading home builders by Texas metro area and as based on total new residential construction permits added to the HBW database during the month of September 2020:

Houston

Last month, there were more than 3,880 housing starts with a total construction value of approximately $690 million in the Houston area.

Out of the 300 active contractors with new construction activity in the Houston area last month, the following ranked as the top five for total new permits on record:

Builder Total Permits
1-D.R. Horton 699
2-K Hovnanian Homes 274
3-Lennar Homes 211
4-Legend Homes 150
5-Pulte Homes 146

Dallas

In the Dallas area, there were nearly 2,415 housing starts with a total construction value in excess of $651 million during the month of September.

Out of the approximately 215 contractors with housing starts in the area, the following ranked as the top five for total new permits:

Builder Total Permits
1-D.R. Horton 407
2-Lennar Homes 167
3-Bloomfield Homes 95
4-Meritage Homes 90
5-Gehan Homes 86

Austin

In the Austin area, there were approximately 860 housing starts with a total construction value in excess of $216 million last month.

Out of the nearly 100 contractors with new residential construction activity on record for the one-month period, the following ranked as the top five for total new permits:

Builder Total Permits
1-D.R. Horton 181
2-Lennar Homes 82
3-Pulte Homes 50
4-KB Homes 42
5-Perry Homes 38

San Antonio

Last month, there were 630 housing starts with a total construction value in excess of $150.5 million in San Antonio. 

Out of the nearly 90 home builders with new permits added to the HBW database during the one-month period, the following ranked as the top five for total new permits:

Builder Total Permits
1-Lennar Homes 67
2-Continental Homes of Texas 59
3-Bella Vista CMI 45
4-LGI Homes 37
5-Fieldstone Communities 34

To gain more information on the builders, homeowners and permits for the construction activity above, check out HBW for your copy of the latest construction data reports. To gain access to the HBW database and receive custom and detailed reports on the latest residential and commercial building activity in Florida, Georgia, Texas, Alabama, and Oklahoma, please contact HBW for details.

Texas Swimming Pool Construction Review – September 2020

An HBW report of the latest construction permit data for new swimming pools in Texas during the month of September 2020

In Texas, there were approximately 1,233 swimming pool construction permits with a total value in excess of $59M added to the HBW database last month.  Out of the four major metropolitan areas reviewed (Dallas, Houston, Austin, San Antonio), Dallas held the highest volume of pool starts (616 new permits) for the one-month period, while Houston carried the highest average value of new pool construction (average value: $57,256).

Here is a closer look at the latest permit data from the HBW database for new swimming pool construction in each of the four major metro areas of the Lone Star State:

Dallas

As previously noted, Dallas held the greatest concentration of new swimming pool construction last month, having more than 615 new permits with a total construction value in excess of $26M.  The average value of pool construction landed mid-range (average value: $42,305) in comparison to other Texas areas reviewed, and more than half of all new permits originated from the two counties of Collin (223 permits) and Tarrant (158 permits).

Out of the more than 185 contractors with new swimming pool construction activity on record for the one-month period, the following ranked as the top three for total new permits:

Builder Total Permits
1-Riverbend Pools 43
2-Foley Custom Pools 29
3- Puryear Custom Pools 28

Houston

Houston ranked #2 for swimming pool construction, having more than 440 pool starts with a total construction value in excess of $25.2M on record last month.  The average value of construction was highest in Houston (average value: $57,256) in relation to other areas reviewed, and the county with the greatest concentration of pool starts was Harris County (184 permits).

Out of the nearly 175 pool builders with new construction activity on record in the Houston areas last month, the following ranked as the top three for total new permits:

Builder Total Permits
1-Mckinney Custom Pools 23
2-Supreme Pools & Spas 22
3-Platinum Pools 21

Austin

Last month, there were nearly 100 swimming pool starts with a total construction value of approximately $5.3M in the Austin area.  The average value of construction landed on the higher end of the spectrum (average value: $54,150) in comparison to other Texas metropolitan areas, and nearly all new swimming pool construction activity took place in Travis County (70 permits).

Out of the nearly 50 contractors with new construction permits on record with HBW for the one-month period, the following ranked as the top three for total new permits:

Builder Total Permits
1-Cody Pools 21
2-Anthony & Sylvan Pools 12
3-Texas Pools & Patios 8

San Antonio

In San Antonio, there were nearly 80 pool starts with a total construction value in excess of $2.4M during the month of September.  The average value of new swimming pool construction was lowest in San Antonio (average value: $31,090) in comparison to other Texas areas reviewed, and more than half of all new permits originated from the County of Bexar (48 permits).

Out of the more than 30 contractors with new swimming pool construction activity on record last month, the following ranked as the top three for total new permits:

Builder Total Permits
1-Keith Zars Pools 14
2-Cody Pools 9
3-Alamo Pool Builders 8


To gain more information on the builders, homeowners and permits for the construction activity above, check out HBW for your copy of the latest construction data reports. To gain access to the HBW database and receive custom and detailed reports on the latest residential and commercial building activity in Florida, Georgia, Texas, Alabama, and Oklahoma, please contact HBW for details.