Texas Top Home Builders – July 2023

Earlier this week, we reported on the latest permit data for new home construction in Texas and discovered that there were 7,865 new permits on record with HBW for the month of July.  Today, we are taking a closer look at the permit data to uncover the leading contractors in each of the four major metropolitan areas of Texas (Dallas, Houston, Austin, San Antonio). 

Across nearly all regions, D.R. Horton led for highest volume of housing starts last month, carrying approximately 1,215 new permits for the one-month period and landing in the #1 spot in Dallas, Houston, and San Antonio.  Following D.R. Horton, Lennar Homes ranked #2 for new home construction in July, having approximately 580 new permits on record with HBW.

Here is a closer look at the five leading contractors in each metro area based on the total number of new residential construction permits generated during the month of July 2023:

Dallas

In Dallas and surrounding areas, there were 280 home builders with new construction activity on record last month, and the following ranked as the top five for total new permits:

BuilderTotal Permits
1-D.R. Horton560
2-Bloomfield Homes140
3-Lennar Homes103
4-Meritage Homes91
5-Trophy Signature Homes86

Houston

Last month, there were nearly 320 contractors with new residential construction permits on record with HBW for the Houston area, and the following ranked as the top five for total new permits:

BuilderTotal Permits
1-D.R. Horton494
2-Lennar Homes323
3-Perry Homes159
4-K Hovnanian Homes147
5-Westin Homes137

Austin

Out of more than 100 home builders with new construction activity on record in Austin last month, the following ranked as the top five for total new permits:

BuilderTotal Permits
1-Lennar Homes64
2-Perry Homes49
3-KB Homes46
4-Pulte Homes39
5-Taylor Morrison Homes37

San Antonio

Out of the 100 contractors with new permits on record in the San Antonio area for the month of July, the following ranked as the top five for total new permits:

BuilderTotal Permits
1-D.R. Horton145
2-Lennar Homes89
3-KB Homes83
4-Continental Homes of Texas62
5-M/I Homes37

To gain more information on the builders, homeowners and permits for the construction activity above, check out HBW for your copy of the latest construction data reports. To gain access to the HBW database and receive custom and detailed reports on the latest residential and commercial building activity in Florida, Georgia, Texas, Alabama, and Oklahoma, please contact HBW for details.

Texas New Home Construction Review – July 2023

Last month, there were 7,865 new residential construction permits with a total value of nearly $2.2 billion added to the HBW database; this total reflects a 12 percent month-over-month increase in new home construction in the Lone Star State.  Out of the four major metro areas reviewed (Dallas, Houston, Austin, San Antonio), the highest volume of housing starts could be found in Houston (3,686 permits), while the highest average value of new home construction took place in Austin (average value: $381,118).

Here is a closer look at the total permits, average value of construction and leading counties in each Texas metro area during the month of July 2023:

Houston

As previously noted, there were 3,686 new residential construction permits added to the HBW database for the Houston area last month.  The average value of new home construction was $251,735, and the majority of permits originated from the two counties of Harris (1,626 permits) and Montgomery (1,133 permits).

Dallas

Last month, Dallas ranked #2 for new home construction, having just over 2,715 new permits on record with HBW for the one-month period.  The average value of new home construction landed on the higher end of the spectrum in Dallas (average value: $296,192) in comparison to other metro areas reviewed, and the bulk of new permits originated from the counties of Tarrant (940 permits) and Collin (608 permits).

San Antonio

Last month, there were nearly 750 new residential construction permits added to the HBW database for the San Antonio area.  The average value of new home construction was lowest in San Antonio (average value: $212,890) in comparison to other areas reviewed, and well more than half of all new permitting activity took place in Bexar County where there were more than 470 new permits on record for the one-month period.

Austin

In Austin, there were 715 new residential construction permits on record for the month of July. As previously noted, the average value of new home construction was highest in the Austin area (average: $381,118) in comparison to other Texas areas reviewed, and more than half of all new construction took place in Travis County (404 permits).

To gain more information on the builders, homeowners and permits for the construction activity above, check out HBW for your copy of the latest construction data reports. To gain access to the HBW database and receive custom and detailed reports on the latest residential and commercial building activity in Florida, Georgia, Texas, Alabama, and Oklahoma, please contact HBW for details.
Texas Swimming Pool Construction Report – July 2023

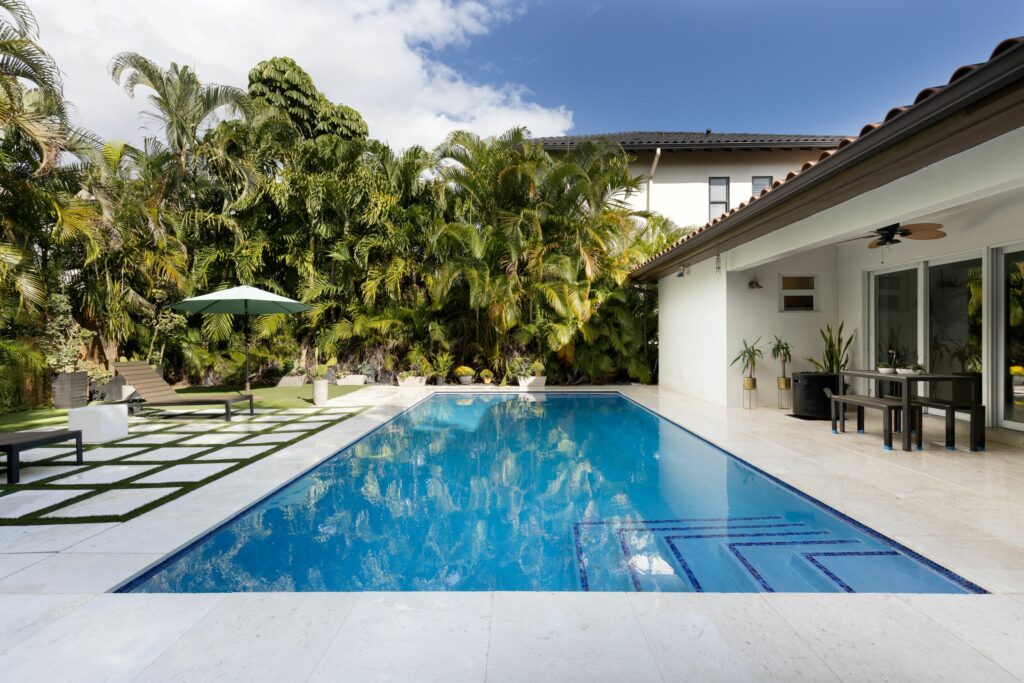
Last month, there were approximately 825 new swimming pool construction permits added to the HBW database for Texas, reflecting a 25 percent month-over-month increase in new pool construction.  Out of the four major metropolitan areas reviewed (Dallas, Houston, Austin, San Antonio), Dallas carried the greatest volume of pool starts (365 permits), while the highest average value of new pool construction could be found in Houston (average value: $72,504).

Here is a closer look at new swimming pool construction activity in Texas based on construction data on record with HBW for the month of July 2023:

Dallas

As previously noted, Dallas carried the highest volume of pool permits last month, having 365 new permits with a total construction value of more than $23 million.  The average value of new swimming pool construction was $63,631, and more than half of all new permits originated from the counties of Tarrant (83 permits) and Denton (92 permits).

Houston

Last month, there were more than 235 new residential construction permits with a total value of $17.2 million added to the HBW database for the Houston area.  The average value of new pool construction was highest in Houston (average value: $72,504) in comparison to other areas reviewed, and the greatest concentration of new pool construction activity could be found in Harris County (153 permits).

Austin

In the Austin area, there were just over 120 new swimming pool construction permits with a total of $7.1 million on record last month.  The average value of new swimming pool construction was $58,261, and the majority of all new permits originated from Travis County (95 permits).

San Antonio

Last month, there were 100 new swimming pool construction permits with a total value of nearly $3.9 million in San Antonio.  The average value of new pool construction was lowest in San Antonio (average value: $38,801) in comparison to other areas reviewed, and the county with the greatest concentration of new swimming pool construction activity was Bexar (79 permits).

To gain more information on the builders, homeowners and permits for the construction activity above, check out HBW for your copy of the latest construction data reports. To gain access to the HBW database and receive custom and detailed reports on the latest residential and commercial building activity in Florida, Georgia, Texas, Alabama, and Oklahoma, please contact HBW for details.
Florida New Home Construction Q2-2023

Since the start of this year (thru Q2-2023), Florida has exhibited a 28 percent year-over-year decrease in new residential construction, resulting in 50,920 new permits on record with HBW.  Out of the six regions reviewed (Central, West, Southeast, Southwest, Northeast, Northwest), all of them demonstrated year-over-year declines in new home construction ranging from -16 percent (Northwest) to -34 percent (Southwest Florida), with West Florida carrying the highest level of new construction activity (12,154 permits)

Here is a closer look at total permits and leading counties for each Florida region at the mid-year point:

West Florida

As previously noted, the western region of Florida carried the greatest amount of new residential construction permits (12,154 permits) through Q2, as well as demonstrated a 27 percent decrease in new permits in comparison to the same time last year.  Out of the seven counties that make up the western region, more than half of all new home construction took place in the counties of Pasco (3,366 permits) and Polk (3,112 permits).

Southwest Florida

Not far behind the western region, Southwest Florida ranked #2 for new home construction, having 11,136 new permits through Q2, reflecting a 34 percent year-over-year decrease in new residential construction.  Out of the five counties that make up the area, just over half of all new permits originated from the two counties of Lee (3,588 permits) and Manatee (2,367 permits).

Northeast Florida

In the northeast, there have been 8,924 new residential construction permits added to the HBW database since the start of this year (thru Q2), reflecting a 33 percent year-over-year decrease in new home construction.  Out of the eight counties that make up the area, nearly half of all new permits originated from the counties of St. Johns and Marion where there were 2,249 and 2,144 permits on record respectively for the six-month period.

Central Florida

Through the second quarter of this year, there have been 8,270 new residential construction permits added to the HBW database for Central Florida, reflecting a 25 percent decrease in new home construction in comparison to the same period last year.  Out of the six counties that make up the area, more than half of all new home construction took place in the two counties of Orange and Brevard where there were 2,270 and 2,183 new permits on record with HBW respectively.

Northwest Florida

Out of the six regions reviewed, the northwest is by far the most expansive, consisting of 16 Florida counties as well as 2 bordering counties in Alabama.  Through the second quarter of this year, there have been 5,920 new residential construction permits in the northwest, reflecting a 16 percent year-over-year decrease in new home construction.  Out of the 18 counties included in the report, nearly half of all new permits originated from the counties of Bay, FL (1,177 permits), Baldwin, AL (908 permits), and Escambia, FL (684 permits).

Southeast Florida

Through Q2-2023, there have been 4,516 new residential construction permits added to the HBW database for the southeastern region of Florida, reflecting a 23 percent decrease in new home construction in comparison to the same time last year. Out of the seven counties that make up the area, more than 60 percent of all new permits originated from the counties of St. Lucie and Palm Beach where there were 1,851 and 917 new permits on record respectively.

To gain more information on the builders, homeowners and permits for the construction activity above, check out HBW for your copy of the latest construction data reports. To gain access to the HBW database and receive custom and detailed reports on the latest residential and commercial building activity in Florida, Georgia, Texas, Alabama, and Oklahoma, please contact HBW for details.
Florida Swimming Pool Construction Report: Q2-2023

Since last year, new swimming pool construction has been declining in the Sunshine State. In 2022, Florida exhibited a 6 percent year-over-year decrease in new pool construction, and so far this year (thru Q2-2023), new swimming pool construction activity is down by 28 percent in comparison to the same time last year.

Through Q2-2023, there have been approximately 15,080 new swimming pool construction permits added to the HBW database for Florida. Out of the six Florida regions reviewed (Central, Southeast, Southwest, West, Northwest, Northeast), the highest volume of new swimming pool construction permits could be found in the southwestern region of the state (4,075 permits), while the lowest level of new construction took place in the northeastern region (1,487 permits). All areas reviewed have exhibited year-over-year decreases in new pool construction ranging from 6 percent (Northwest) to 38 percent (Southwest).

Here is a quick view of some of the latest permit data and leading counties by region:

Southwest Florida

As previously noted, there has been a 38 percent year-over-year decrease in new pool construction in the southwestern region of Florida, resulting in nearly 4,075 new permits on record with HBW through the second quarter of this year.  Out of the five counties included in the report, Lee County held the highest volume of new pool construction activity (1,007 permits), as well as the most significant year-over-year decrease in new permits (-50% YTD).

Southeast Florida

In the southeastern region of Florida there have been more than 2,940 new swimming pool construction permits added to the HBW database since the start of this year (thru June 2023), reflecting a 27 percent year-over-year decrease in new pool construction.  Out of the seven counties reviewed, the greatest concentration of new construction activity could be found in Palm Beach (931 permits) and Miami-Dade (674 permits), with both areas demonstrating a 34 percent year-over-year decrease in new pool construction.

West Florida

From January through June 2023, there have been approximately 2,820 new swimming pool construction permits added to the HBW database for West Florida, reflecting a 21 percent year-over-year decrease in new swimming pool construction.  Out of the seven counties reviewed, close to half of all new permits originated from the two counties of Hillsborough (858 permits) and Polk (534 permits), with both counties reflecting a 24 percent year-over-year decrease in pool construction.

Central Florida

Through Q2-2023 there have been 2,200 pool starts in the Central Florida area, reflecting a 24 percent year-over-year decrease in new swimming pool construction.  Out of the six counties reviewed, more than half of all new pool construction originated from the counties of Orange (768 permits) and Brevard (469 permits), with both areas demonstrating year-over-year decreases in new construction of 20 percent (Orange) and 24 percent (Brevard).

Northwest Florida

In the northwestern region of Florida, there have been more than 1,555 new swimming pool construction permits added to the HBW database through the second quarter of this year, reflecting a 6 percent year-over-year decrease in pool starts.  Out of the 18 counties reviewed, the highest concentration of new pool construction could be found in Walton County (315 permits) where there has been a 3 percent year-over-year decrease in new swimming pool construction.

Northeast Florida

Through Q2-2023, the northeastern region of Florida has experienced a 29 percent year-over-year decrease in new swimming pool construction, resulting in nearly 1,490 new permits on record with HBW.  Out of the eight counties reviewed, more than half of all new permitting activity took place in the counties of St. Johns (533 permits) and Duval (283 permits) where there have been year-over-year decreases in pool construction of 35 percent and 28 percent respectively.

To gain more information on the builders, homeowners and permits for the construction activity above, check out HBW for your copy of the latest construction data reports. To gain access to the HBW database and receive custom and detailed reports on the latest residential and commercial building activity in Florida, Georgia, Texas, Alabama, and Oklahoma, please contact HBW for details.
HBW Quarterly: Texas Home Construction Q2-2023

A review of permit data for new home construction in Texas thru Q2-2023

Since the start of this year (through June 2023), new home construction has continued to decline in the Lone Star State.  Based on the latest data available from the HBW database, there has been a 32 percent year-over-year decrease in new residential construction from the combined metro areas of Dallas, Houston, Austin, and San Antonio, resulting in 35,077 new permits added to the HBW database for the 6-month period.  Across all areas, there has been a marked drop in housing starts, with year-over-year decreases ranging from 25 percent (Houston) to 50 percent (Austin) through June 2023.

Here is a closer look each metro area, total permits, and leading counties for new home construction through the second quarter of this year:

Houston

Since the start of this year (through June), there have been more than 16,520 new residential construction permits added to the HBW database for the Houston area, reflecting a 25 percent year-over-year decrease in new residential construction.  More than half of all new permits originated from Harris County (8,820 permits), and the only county that has reflected gains in residential construction so far this year is Galveston (504 permits) with a 7 percent year-over-year increase in new home construction.

Dallas

Dallas and surrounding areas ranked #2 for new residential construction, having 12,220 new permits on record through the second quarter of this year, reflecting a 30 percent year-over-year decrease in new home construction.  More than half of all new construction activity took place in the counties of Tarrant (3,587 permits) and Collin (3,610 permits), and in comparison to other Texas metro areas reviewed, Dallas is leading for higher value home construction (value >$500k), having 1,950 new higher value residential construction permits on record for the 6-month period.

Austin

In Austin, there were 3,430 new residential construction permits on record with HBW through Q2-2023, reflecting a 50 percent year-over-year decrease in new home construction activity.  Out of the four counties reviewed, Travis County (1,613 permits) and Williamson County (1,116 permits) carried the greatest concentration and majority of new home construction activity for the 6-month period.

San Antonio

Through the second quarter of this year, there have been 2,905 new residential construction permits added to the HBW database for the San Antonio area, reflecting a 45 percent year-over-year decrease in new home construction.  Out of the three counties reviewed, the greatest amount of new home construction activity took place in Bexar County (1,896 permits).

To gain more information on the builders, homeowners and permits for the construction activity above, check out HBW for your copy of the latest construction data reports. To gain access to the HBW database and receive custom and detailed reports on the latest residential and commercial building activity in Florida, Georgia, Texas, Alabama, and Oklahoma, please contact HBW for details.

Texas Swimming Pool Construction Quarterly Report

Based on the latest Swimming Pool Construction Activity Trend Report for Texas (thru Q2-2023), new pool construction in Texas is continuing to slide and decrease in comparison to recent years.  Since the start of this year (thru June 2023), there have just over 4,445 new swimming pool construction permits added to the HBW database from the combined areas of Dallas, Houston, Austin and San Antonio, reflecting a 38 percent year-over-year decrease in new pool construction.  Out of the four metro areas reviewed, the greatest concentration of new pool construction activity could be found in Dallas (2,079 permits), and at the same time, the most significant decline in new construction took place in Dallas (-40% YOY).

Here is a closer look at permit totals, leading counties, and % change (YTD) in new swimming pool construction in each of the four major metropolitan areas of Texas:

Dallas

Since the start of this year (thru June), there have been 2,079 new swimming pool construction permits added to the HBW database for Dallas and surrounding areas.  While Dallas carried a greater amount of pool starts for the six-month period in comparison to other regions reviewed, pool construction has been on a marked decline since last year; in 2022, the market exhibited a 1 percent year-over-year spike, and so far this year, the area has demonstrated a 40 percent year-over-year decrease in pool construction.  Out of the six counties factored into the equation, more than half of all new pool construction activity took place in Dallas County (557 permits) and Tarrant County (503 permits), where there were year-over-year decreases of 25 percent and 37 percent respectively.

Houston

As all Texas metro areas reviewed, Houston has also demonstrated a decline in pool construction since the start of this year, having a 37 percent year-over-year decrease in construction activity that resulted in 1,247 new swimming pool construction permits on record with HBW (thru Q2-2023).  Out of the five counties that make up the Houston area, the majority of new construction took place in Harris County (787 permits) which has experienced approximately a 29 percent year-over-year decrease in new permits.

Austin

While Austin has reflected a growth pattern in new pool construction from 2018 through 2022, so far this year things appear to be on a downward slope.  From January through June 2023, the Austin area has exhibited a 37 year-over-year decrease in pool starts, resulting in nearly 675 new swimming pool construction permits on record for the six-month period.  Out of the four Austin-area counties reviewed, nearly all new pool construction took place in Travis County (520 permits) and Williamson County (111 permits).

San Antonio

Through the second quarter of this year, there have been 447 new swimming pool construction permits added to the HBW database for San Antonio, reflecting a 28 percent year-over-year decrease in new pool construction activity.  Out of the three counties that make up the San Antonio area, Bexar County carried the highest volume of new construction activity, having experienced a 27 percent year-over-year decrease that resulted in nearly 320 new permits on record with HBW for the 6-month period.

To gain more information on the builders, homeowners and permits for the construction activity above, check out HBW for your copy of the latest construction data reports. To gain access to the HBW database and receive custom and detailed reports on the latest residential and commercial building activity in Florida, Georgia, Texas, Alabama, and Oklahoma, please contact HBW for details.

Florida Residential Construction Report – June 2023

Last month, Florida experienced approximately a 12 percent month-over-month decrease in new home construction – Across the five major regions of Florida (Southwest, Tampa, Jacksonville, Orlando, Southeast) there were 7,455 new residential construction permits with a total value of nearly $2.4 billion during the month of June.  Out of the five regions reviewed, Tampa carried the greatest volume of new residential construction (2,095 permits), while the highest average value of construction could be found in the southeastern region of the state (average value: $432,946).

Here is a look at permit details for new home construction in the Sunshine State by region, inclusive of total permits, construction values, and leading counties for the month of June 2023:

Tampa

As previously noted, the Tampa area held the highest concentration of housing starts out of the five Florida regions reviewed, having nearly 2,100 new permits with a total construction value of approximately $590.4 million on record with HBW last month.  More than half of all new construction took place in the counties of Pasco (639 permits) and Polk (578 permits), and the average value of new home construction was $281,798.

Southwest

Not far behind Tampa, the southwestern region of Florida had more than 1,960 new residential construction permits with a total value of approximately $615 million on record with HBW for the month of June.  The average value of new home construction was $313,330, and the majority of permits originated from the counties of Manatee (574 permits) and Lee (554 permits).

Orlando

In Orlando, there were nearly 1,465 new residential construction permits with a total value of $514.5 million last month.  The average value of new home construction was $351,699, and nearly half of all new permits originated from the two counties of Brevard (363 permits) and Orange (353 permits).

Jacksonville

In the Jacksonville area, there were approximately 1,130 new residential construction permits with a total value of $312 million on record with HBW last month.  The average value of new home construction was lowest in Jacksonville (average value: $276,354) in comparison to other regions reviewed, and the majority of all new permits originated from the counties of St. Johns (415 permits) and Duval (334 permits).

Southeast

Last month, there were more than 800 new residential construction permits with a total value of approximately $349 million in the southeastern region of Florida.  As previously noted, the average value of new home construction was highest in the southeast (average value: $432,946) in comparison to other Florida regions reviewed, and the bulk of all new residential construction activity took place in the counties of St. Lucie (374 permits) and Miami-Dade (123 permits).

To gain more information on the builders, homeowners and permits for the construction activity above, check out HBW for your copy of the latest construction data reports. To gain access to the HBW database and receive custom and detailed reports on the latest residential and commercial building activity in Florida, Georgia, Texas, Alabama, and Oklahoma, please contact HBW for details.

HBW Report: Florida Swimming Pool Construction – June 2023

Based on the latest construction data reports from HBW, there were 2,005 new swimming pool construction permits with a total value in excess of $148M added to the HBW database for Florida during the month of June; this figure represents a 15 percent month-over-month decrease in new pool construction statewide.

Here is an overview of where new swimming pool construction is hot (and not), as well as the leading counties and contractors driving new pool construction across the Sunshine State:

New Permits by Region

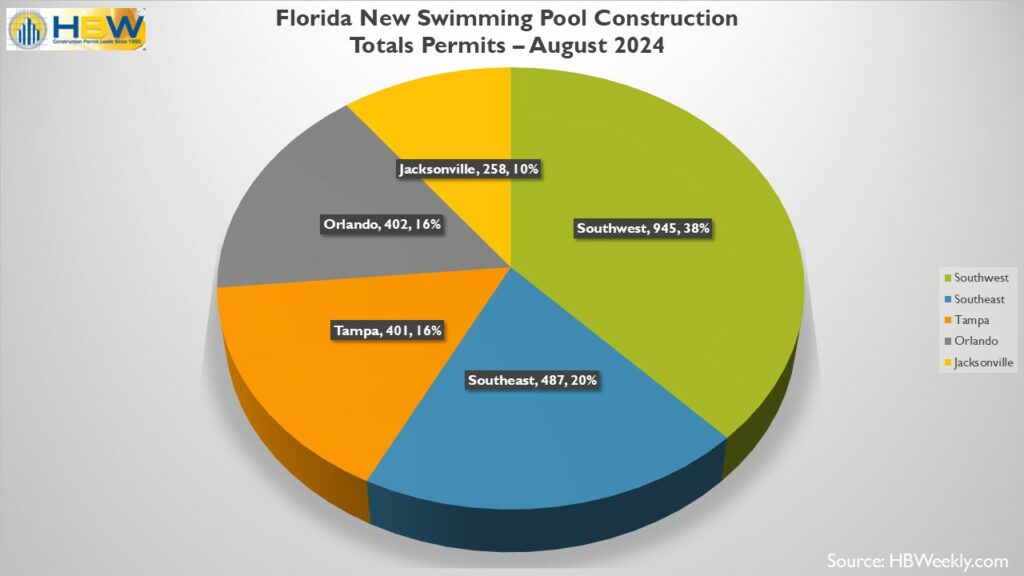
Out of the five Florida regions reviewed (Southwest, Tampa, Orlando, Southeast, Jacksonville), the southwestern region (608 permits) carried the highest concentration of new pool construction activity, while the fewest new permits originated from Jacksonville (201 permits); the breakdown of total permits by region is as follows:

Average Value of Construction

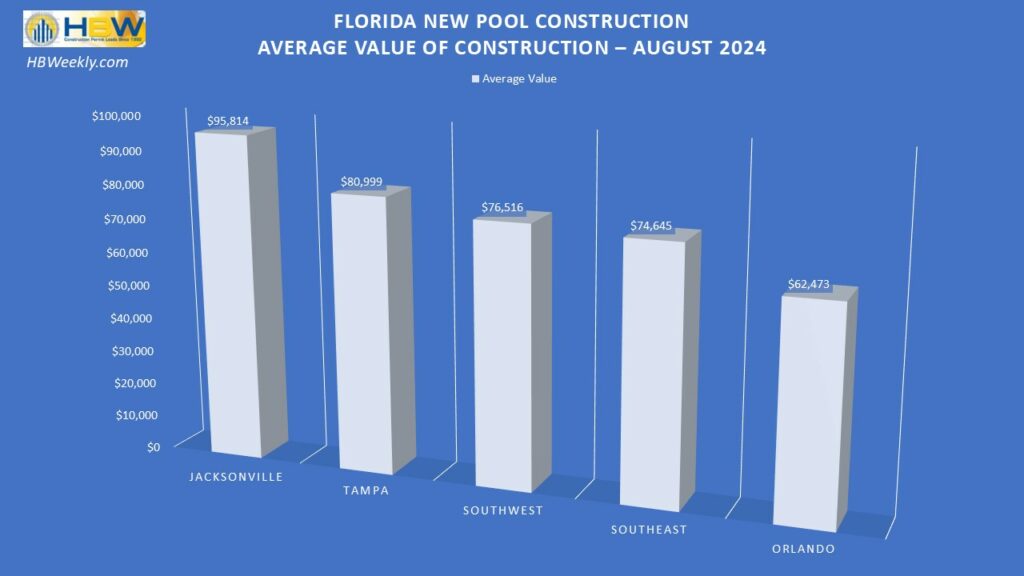
The average value of new swimming pool construction in Florida last month ranged from a low of $68,063 (Orlando) to a high of $92,889 (Jacksonville). The average value of new construction projects by region is as follows:

  1. Jacksonville (average value: $92,889)
  2. Tampa (average value: $77,857)
  3. Southwest (average value: $71,617)
  4. Southeast (average value: $69,719)
  5. Orlando (average value: $68,063)

Top Counties

Out of all the counties included in the latest construction data reports for Florida, the following ranked as the top five for new swimming pool construction (based on total permits on record for June):

  1. Palm Beach County (Southeast) – 190 permits
  2. Lee County (Southwest) – 159 permits
  3. Collier County (Southwest) – 156 permits
  4. Hillsborough County (Tampa) – 122 permits
  5. Miami-Dade (Southeast) – 120 permits

Top Ranked Pool Builders

As with every month, each region had its own unique lineup of leading contractors driving new pool construction during the one-month period. For this reason, we pulled the #1 ranked pool builder for each region based on the total number of new permits added to the HBW database last month; those builders are as follows:

Southwest – Aragon Pools & Spas (84 permits)

Jacksonville – Agua Pools & Spas (36 permits)

Orlando – Bob’s Pool Service (26 permits)

Tampa – Bob’s Pool Service (26 permits)

Southeast – Fountain Blue Pool Service (25 permits)

To gain more information on the builders, homeowners and permits for the construction activity above, check out HBW for your copy of the latest construction data reports. To gain access to the HBW database and receive custom and detailed reports on the latest residential and commercial building activity in Florida, Georgia, Texas, Alabama, and Oklahoma, please contact HBW for details.

Texas Swimming Pool Construction Report – June 2023

Last month, there were 660 new swimming pool construction permits with a total construction value of approximately $41.3 million added to the HBW database for Texas.  Out of the four major areas reviewed (Dallas, Houston, Austin, San Antonio), Dallas (305 permits) carried the highest volume of new pool construction during the one-month period, while the Houston area carried the highest average value of new pool construction projects (average value: $80,615).

Here is a closer look at the total permits, construction values, leading counties, and top contractors on record with HBW for new pool construction in the Lone Star State during the month of June 2023:

Dallas

As previously mentioned, nearly half of all new pool construction recorded for Texas last month took place in the Dallas area; during the month of June, there were 305 new permits with a total construction value of $17.2 million.  The average value of new pool construction was $56,410, and more than half of all new construction took place in the counties of Tarrant (72 permits) and Collin (85 permits).

Out of 170 contractors in the Dallas area with new pool construction activity on record with HBW last month, the following ranked as the top three for total new permits:

BuilderTotal Permits
1-Riverbend Pools22
2-Bright Pools10
3-Robertson Pools9

Houston

Houston ranked #2 for new pool construction last month, having more than 205 new permits with a total construction value in excess of $16.6 million on record with HBW.  The average value of new pool construction in Houston (average value: $80,615) was higher than any other Texas metro area reviewed, and the bulk of all new permits originated from Harris County (157 permits).

Out of approximately 100 contractors with new swimming pool construction activity on record in the Houston area last month, the following ranked as the top three for total new permits:

BuilderTotal Permits
1-Platinum Pools12
2-Blue Haven Pools11
3-Anthony & Sylvan Pools9

Austin

In Austin, there were approximately 100 new swimming pool construction permits with a total value of nearly $5.8 million on record last month.  The average value of construction was $58,392, and the majority of new swimming pool construction took place in Travis County (78 permits).

Out of nearly 55 contractors with new pool construction activity on record last month, the following ranked as the top three for total new permits:

BuilderTotal Permits
1-Cody Pools9
2-Aquamarine Pools7
3-Fun-N-Sun Pools of Austin7

San Antonio

Last month, there were 50 new swimming pool construction permits with a total value of $1.67 million added to the HBW database for the San Antonio area.  The average value of new pool construction in San Antonio (average value: $33,400) was lowest in comparison to other areas reviewed, and most new permits originated from Bexar County (40 permits).

Out of nearly 30 active pool contractors with new construction activity on record in the San Antonio area last month, the following ranked as the top three for total new permits:

BuilderTotal Permits
1-Keith Zars Pools9
2-Cody Pools5
3-Aquamarine Pools3

To gain more information on the builders, homeowners and permits for the construction activity above, check out HBW for your copy of the latest construction data reports. To gain access to the HBW database and receive custom and detailed reports on the latest residential and commercial building activity in Florida, Georgia, Texas, Alabama, and Oklahoma, please contact HBW for details.