
A review of new pool permits and leading swimming pool builders in Florida during the month of February 2018.
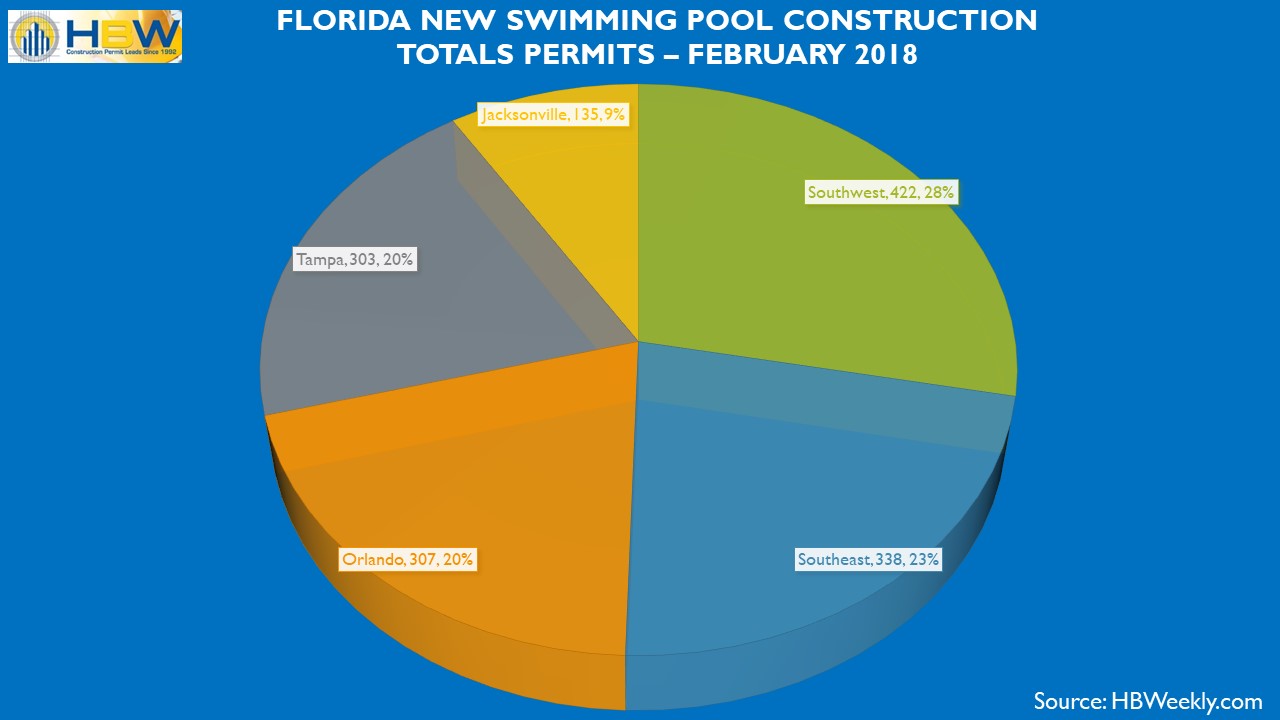
FL Pool Permits by Area – Feb. 2018
In February, there were more than 1,500 new swimming pool permits added to the HBW database. Out of the five major regions (Southeast, Southwest, Orlando, Tampa, Jacksonville) reviewed, Southwest Florida continued to have the greatest total number of pool starts (422 permits) on file for the one-month period, while Jacksonville held the least (135 permits). The average value of pool construction throughout the Sunshine State ranged from the approximately $40k on the lower end (Orlando) to as high as nearly $51k on the higher end (Jacksonville).
Here is a closer look at new pool construction and the regional builders leading new permitting activity by area:
Southwest
As previously mentioned, the southwestern region of Florida ranked #1 for total swimming pool starts having more than 420 new permits added to the HBW database last month. The breakdown is as follows:
Average Value of Construction: $43,724
Top County for Total Permits: Lee County (130 permits)
Total # of Active Builders in the Area (February): 110+
Top Pool Builders (highest total number of pool starts): #1 – Aragon Pools and Spas; #2 – Aquadoc; #3 – Coast to Coast Pools
Southeast
The Southeast ranked second highest for new pool construction as there were 338 swimming pool starts with an average value of $40,321 last month.
Top County for Total Permits: Palm Beach (112 permits)
Total # of Active Builders in the Area (February): 130
Top Pool Builders (highest total number of pool starts): #1 – A&G Concrete Pools; # 2 – Treasure Pools & Service; #3 – Pools by Greg
Orlando
The central portion of the state (Orlando and surrounding areas) ranked third highest for total pool starts having 307 new permits on file with HBW last month. The average value of new pool construction was lower in Orlando than any other region at $39,630.
Top County for Total Permits: Osceola (113 permits)
Total # of Active Builders in the Area (February): ~70
Top Pool Builders (highest total number of pool starts): #1 – All Seasons; # 2 – Bob’s Pool Service; #3 – American Pools & Spas.
Tampa
The Tampa area held a close fourth for new pool construction. Last month, there were just over 300 pool starts with an average value of $46,246.
Top County for Total Permits: Hillsborough (95 permits)
Total # of Active Builders in the Area (February): 95
Top Pool Builders (highest total number of pool starts): #1 – Gulfstream Pools and Spas; # 2 – Tampa Bay Pools; #3 – T&D Pool and Spa Service.
Jacksonville
While Jacksonville had the least total number of pool starts (135 permits), the area continued to maintain a higher average value for new pool construction ($50,721).
Top County for Total Permits: St. Johns (45 permits)
Total # of Active Builders in the Area (February): 55
Top Pool Builders (highest total number of pool starts): #1 – Stanley Pools; # 2 – Pools by John Clarkson; #3 – Blue Haven Pools.
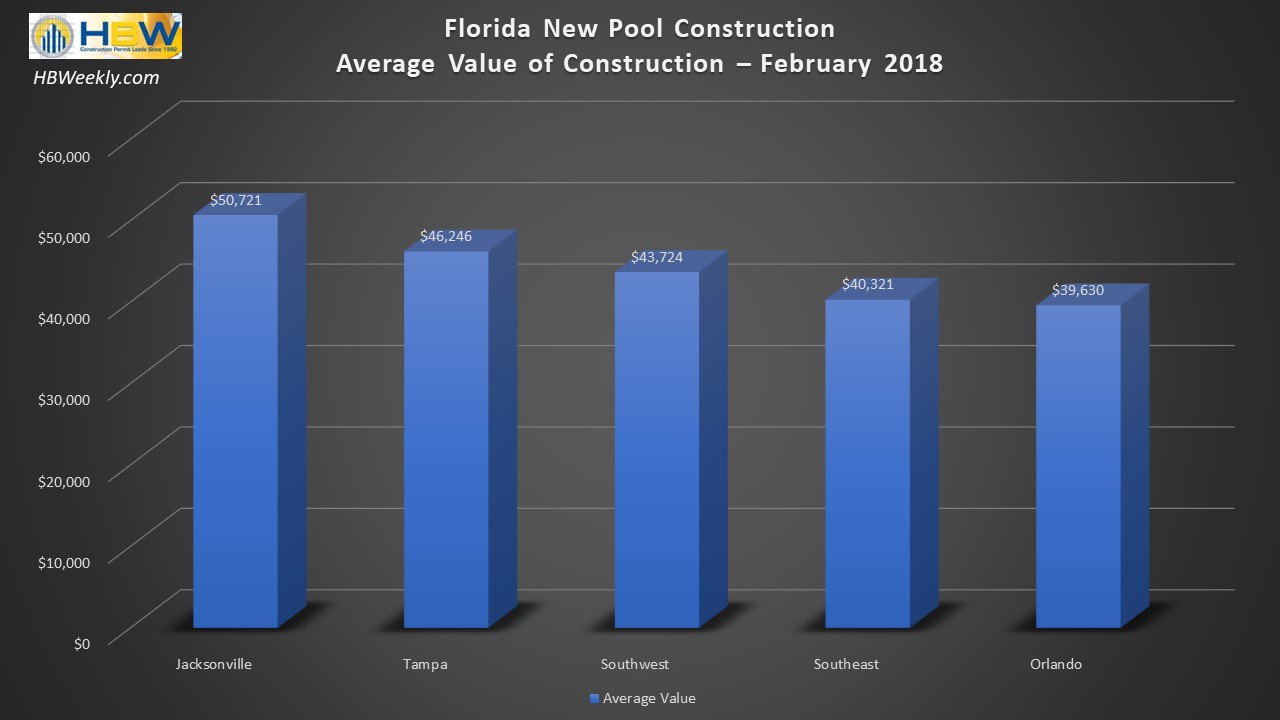
FL Average Value of Pool Construction – Feb. 2018
To gain more information on the builders, homeowners and permits for the construction activity above, check out HBW for your copy of the latest construction data reports. To gain access to the HBW database and receive custom and detailed reports on the latest residential and commercial building activity in Florida, Georgia, Texas, Alabama, and Oklahoma, please contact HBW for details.