
With a 6% year-over-year increase in new swimming pool construction through Q3, Florida continues its five-year growth pattern in pool starts across the state.
Out of the nearly 18,400 new swimming pool permits on file with HBW for Florida through Q3, every major region has experienced growth in swimming pool starts. While the southwest region continues to lead for total permits (4,700+ permits thru Q3), it’s the northeast region that has seen the greatest year-over-year increase (+12%) in new pool construction. West Florida is also exhibiting impressive year-over-year gains of 10% having more than 3,150 swimming pool starts through the third quarter.

FL Pool Permits by Area Q3-2017
When breaking new pool construction down by county, it is Lee County (SW) that takes top spot for total pool starts with 1,527 new permits on file through Q3, reflecting a 9% increase in comparison to the same time last year. Not far behind, Palm Beach County (SE) has held a steady stream of new pool construction since last year, and Q3 has been its best quarter so far in 2017. With 1,255 new swimming pool construction permits on file, Palm Beach County is slated to be at or slightly below last year’s figures by the end of this year. Holding in at the third highest for new pool construction, Orange County (Central FL/Orlando area) ranks third; having a 10% year-over-year increase in construction activity there were more than 1,200 new swimming pool construction permits added to the HBW database for Orange County through the third quarter.
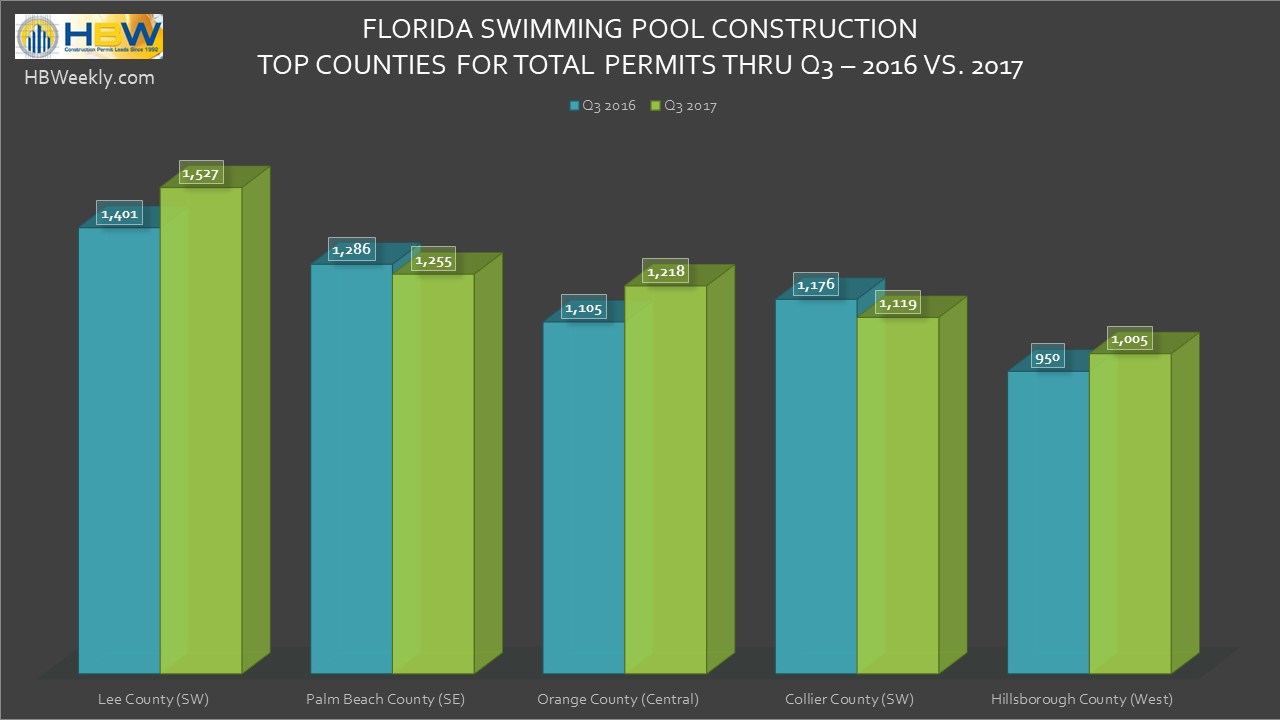
FL Top 5 Counties for Swimming Pool Permits Q3, 2016 vs. 2017
While there have been gains in swimming pool construction throughout every major region across the Sunshine State, there are a few counties that are looking like “ones to watch” as far as growth is concerned. For example, Brevard County (Central) is already ahead of construction totals from the last five years; having nearly 750 swimming pool starts through Q3 of this year, Brevard has experienced a 22% year-over-year increase, with the third quarter having the highest concentration of new construction activity this year. Other counties with marked increases in new pool construction include Pasco County in the western region (+17%) and Clay County in the northeast (+27%).
Information utilized for the graphs and above listed figures for swimming pool construction in Florida was directly derived from HBW construction data reports. To gain access to the HBW database and receive custom and detailed reports on the latest residential and commercial building activity in Florida, Georgia, Texas, Alabama, and Oklahoma, please contact HBW for details.