
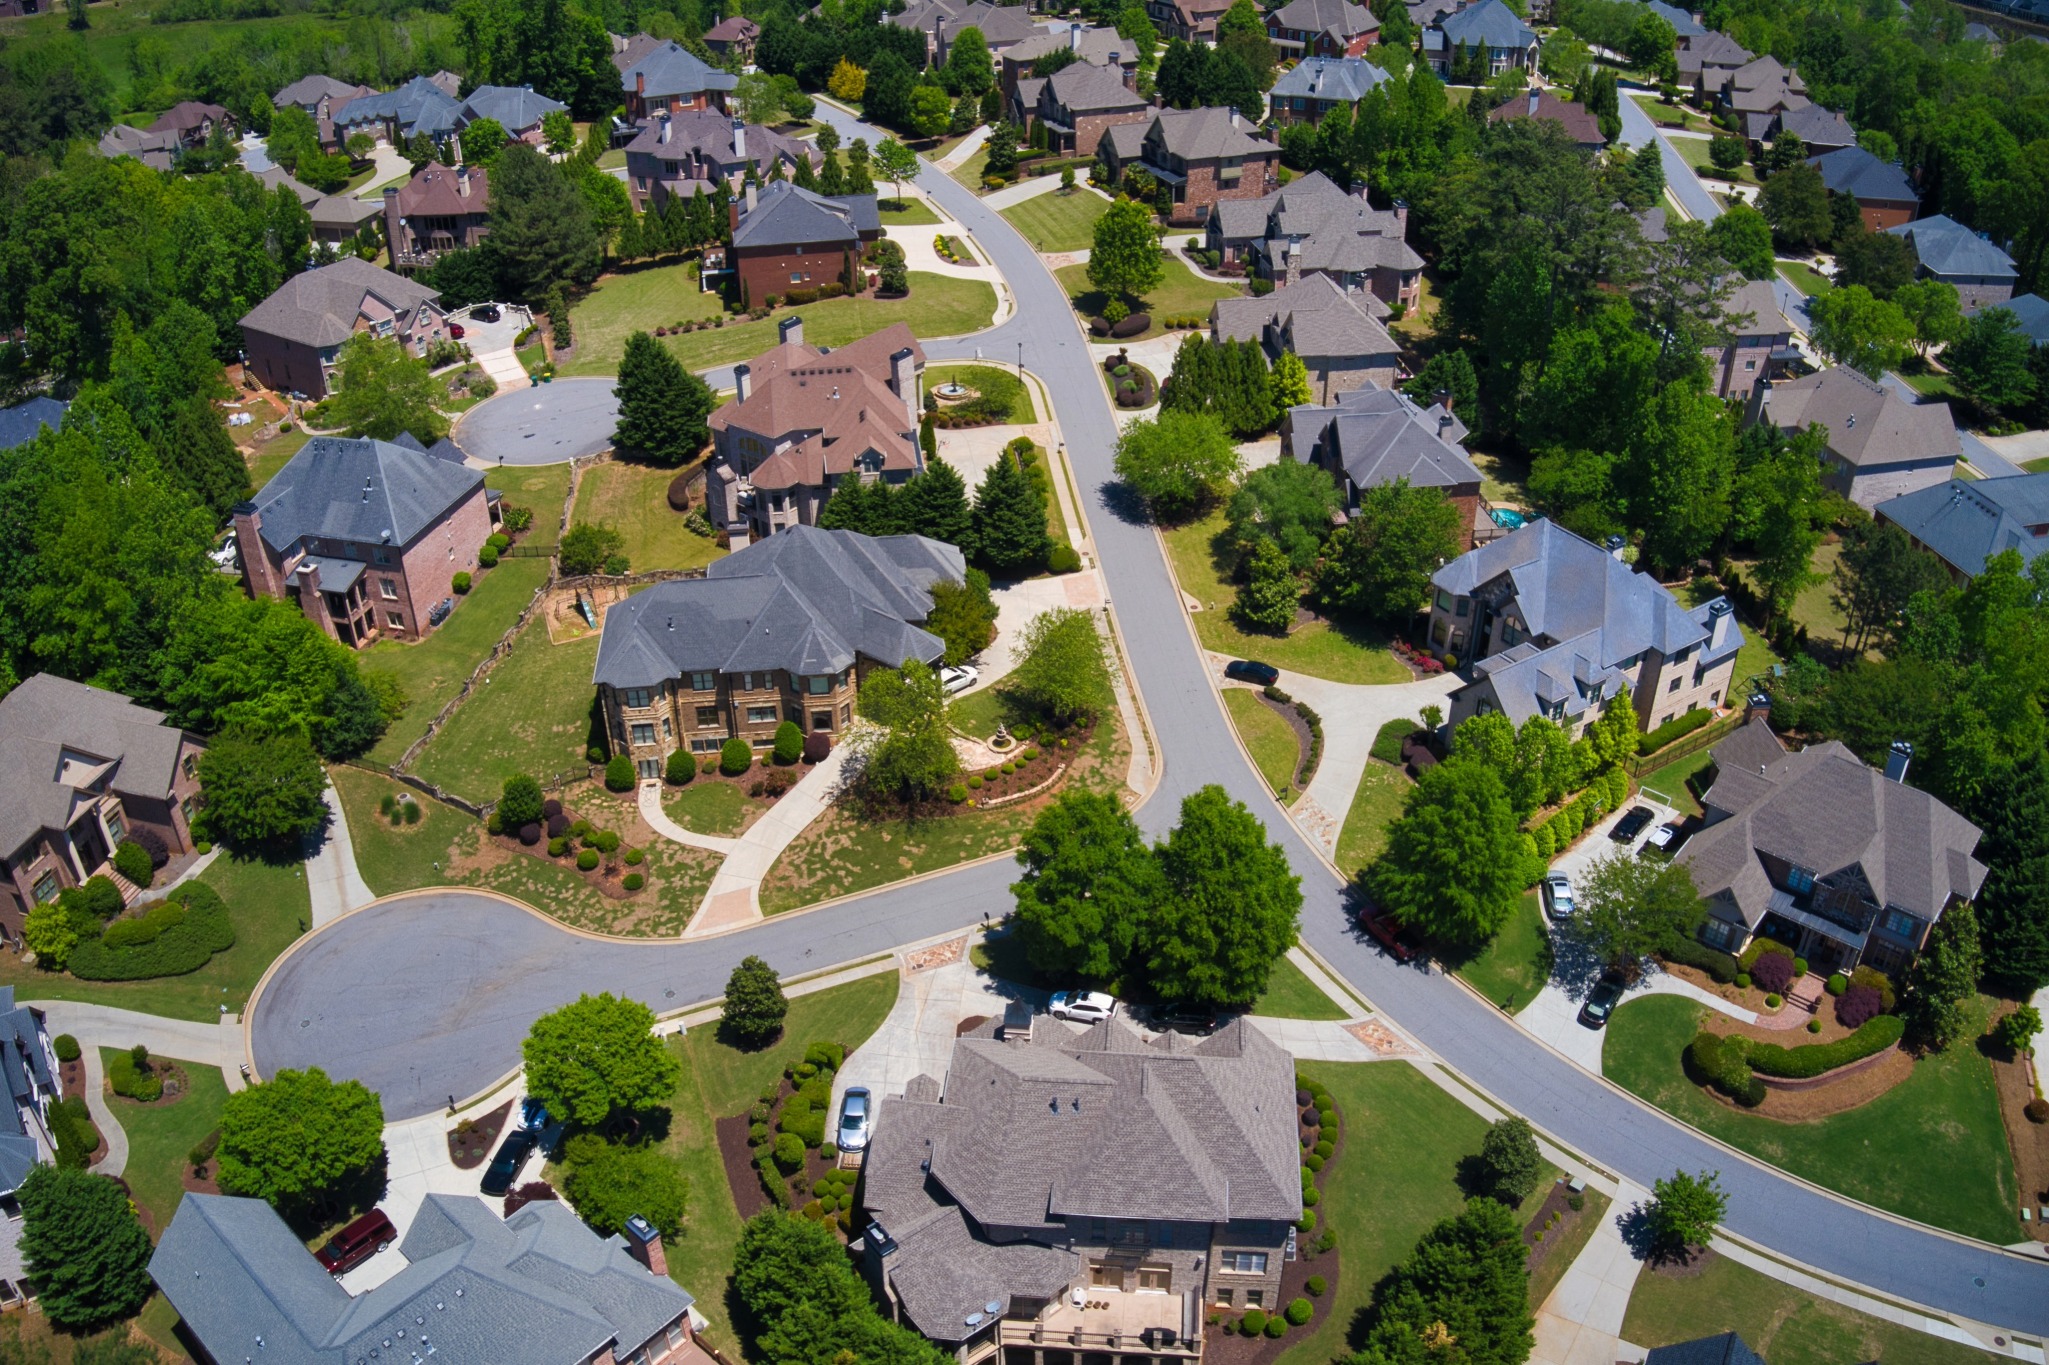
Metro Atlanta’s residential construction market has always had a personality of its own—dynamic, occasionally unpredictable, and never boring. As we reach the midpoint of 2026, HBW’s latest Building Activity Trend Report gives us a clear snapshot of how the region’s builders, developers, and homebuyers are shaping activity across the 24‑county metro area. And while the numbers show a continued cooling trend, the story is far from doom and gloom.
Overall Market Performance: A Continued Decline, But with Moderation
Through Q2 2026, the HBW database recorded 9,636 new residential construction permits, marking an 11% year‑over‑year decrease compared to the same period in 2025.
Now, before anyone gasps dramatically, let’s remember the context: 2025 saw a 15% decline compared to 2024. So yes, the downward trend is continuing—but at a slightly gentler slope.
In market‑analysis terms, this suggests a softening market rather than a contractionary shock. Demand has certainly not evaporated; it is simply recalibrating. And with half the year still ahead, the final trajectory of 2026 remains unwritten. Here is a quick overview of county-by-county activity so far this year:
Gwinnett County – 1,546 permits (↓ 6% YOY)
Gwinnett continues to dominate the metro area in sheer volume. The 6% decline is modest and aligns with broader regional cooling. In market terms, Gwinnett is exhibiting what some may call controlled deceleration, not instability. And in the higher‑value segment (homes valued over $500,000), Gwinnett is a standout:
- 2025: 1,028 higher‑value permits
- 2026 Q1: 239
- 2026 Q2: 355
With 594 higher‑value permits already logged through the second quarter, Gwinnett is more than halfway to last year’s total—an encouraging sign for the upper‑tier market.
Hall County – 897 permits (↑ 16% YOY)
Hall County is the overachiever of the class—again.
- 2024: +26% YOY
- 2025: +14% YOY
- 2026 (so far): +16% YOY
This county has been on a multi‑year growth streak, and 2026 is continuing the momentum. Hall’s sustained expansion suggests structural demand rather than a temporary spike. It is one of the clearest indicators of where builders see long‑term opportunity.
Fulton County – 753 permits (flat YOY)
Fulton is the picture of stability—no increase, no decrease, just steady activity. In market‑speak, Fulton is demonstrating equilibrium conditions, which is often just as valuable as growth. Stability means predictability, and predictability keeps builders confident.
Higher‑value permits also reflect this steadiness:
- 2025: 581
- 2026 Q1: 128
- 2026 Q2: 125
So far, the pace is consistent, mirroring Fulton’s overall permit trend.
Cherokee County – 678 permits (↓ 18% YOY)
Cherokee County’s decline so far this year should not be surprising. The county has posted YOY decreases ranging from 10% to 19% for three consecutive years. Such a continued drop could suggest a market normalization phase, where previous growth years have given way to a more measured level of activity.
Still, Cherokee remains a hub for higher‑value construction:
- 2025: 540 higher‑value permits
- 2026 Q1: 144
- 2026 Q2: 198
With 342 higher‑value permits already logged, Cherokee is pacing ahead of last year in this segment—an interesting contrast to its overall decline.
Barrow County – 637 permits (↑ 11% YOY)
Barrow is quietly becoming one of the metro area’s most reliable growth markets.
- YOY increases every year since 2023
- 2025: +20%
- 2026 (so far): +11%
This pattern suggests Barrow is experiencing sustained organic growth, possibly driven by affordability and continued suburban expansion.
Counties Exhibiting Noteworthy Change
The following counties may not have the highest volumes, but their percentage shifts are significant enough to deserve attention…
Carroll County – 396 permits (↑ 26% YOY) – Carroll is having a strong year, with a 26% increase and a multi‑year pattern of rising activity since 2024.This is a classic example of a secondary market gaining traction, which can often be driven by spillover demand from higher‑priced neighboring counties.
Jackson County – 425 permits (↑ 10% YOY) – After a tough 2025 marked by a 24% decline, Jackson’s rebound is refreshing.A 10% increase suggests the county may be returning to healthier activity levels, closer to what was seen in 2023 and 2024.
DeKalb County – 341 permits (↑ 18% YOY) – DeKalb’s growth is notable because it follows a sharp 24% decline in 2025.Such an uptick at the mid-year point could signal a market recovery phase, especially given DeKalb’s strong performance in 2024. It is one of the counties to watch as the year progresses.
Higher‑Value Residential Construction (Permits Over $500,000)
The “higher value” segment often reflects buyer confidence, builder optimism, and broader economic conditions. Three counties that stand out here are as follows:
Gwinnett County – Already at 594 higher‑value permits halfway through the year—well past the midpoint of 2025’s total.
Cherokee County – With 342 higher‑value permits logged, Cherokee is pacing ahead of last year despite overall permit declines.
Fulton County – Steady as ever, with 253 higher‑value permits through Q2, mirroring last year’s consistency.
The trends suggest that while overall permit activity is cooling, the upper‑tier market remains resilient, particularly in counties with strong school systems, established amenities, and ongoing luxury development.
The metro Atlanta residential construction market is showing a continued but moderating decline in overall permit activity. Some counties are cooling, others are accelerating, and a few are staging comebacks. In other words, it’s a classic Atlanta market—never uniform, always interesting. And let’s be clear: This is just the halftime report. Markets have a way of surprising us in Q3 and Q4. Builders adjust, buyers re‑enter the picture, interest rates wiggle, and suddenly the narrative shifts. So, while the data gives us a solid foundation for analysis, it is not carved in granite—more like written in wet concrete that still has time to cure.
If the first half of 2026 is any indication, the rest of the year will continue to reveal a market that is recalibrating. Growth pockets remain strong, higher‑value construction is holding steady in areas, and several counties are showing signs of renewed momentum. And in true Atlanta fashion, the story is still unfolding.
Information utilized for the above listed figures for Metro Atlanta residential construction was directly derived from HBW construction data reports. To gain access to the HBW database and receive custom and detailed reports on the latest residential and commercial building activity in Florida, Georgia, Texas, Alabama, and Oklahoma, please contact HBW for details.