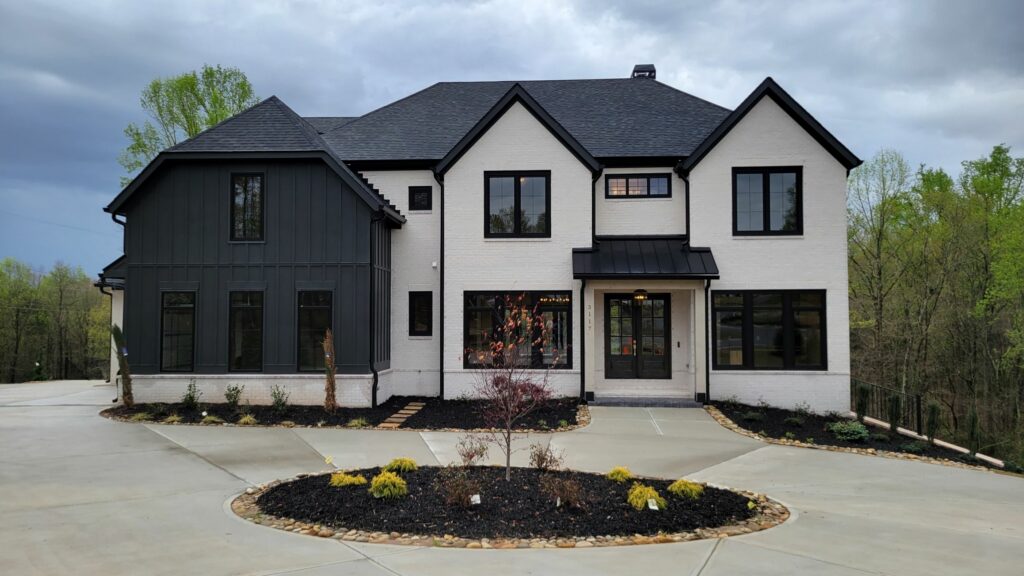
As we reach the midpoint of 2025, new residential construction in the Metro Atlanta area reflects a tempered but active market. According to HBW’s latest Building Activity Trend Report, a total of 10,757 new residential construction permits were added to the HBW database from January through June of this year. This represents a 6 percent year-to-date decrease in comparison to the same period in 2024. While the data signals a moderate decline in volume, market analysts and contractors alike understand that year-end outcomes remain uncertain, and mid-year reviews serve as valuable indicators of shifting patterns and emerging growth.
HBW’s reporting through the second quarter provides insight into current construction patterns across the 24 counties that make up the Metro Atlanta area. The first half of 2025 was marked by 4,991 new permits in Q1 and 5,766 permits in Q2, signaling a modest gain in quarterly activity despite the overall year-to-date dip.
While mid-year figures do not predict the total outcome of the year, they offer key benchmarks. Construction permits serve as leading indicators—they reflect builder sentiment, anticipated demand, and capital investment. Metrics such as these can enable contractors to forecast future workload, allocate labor resources, and make informed purchasing decisions. Although external factors like interest rates, inflation, and inventory levels will continue to shape the year’s final trajectory, mid-year analysis provides a vital checkpoint for assessing performance and planning ahead.
Market Trends and Historical Context
In a broader context, Metro Atlanta’s construction market has experienced notable fluctuation over the past several years:
- 2021: +21% increase in total permits
- 2022: -18% annual decrease
- 2023: -7% annual decrease
- 2024: +6% rebound in annual activity
- 2025 (thru Q2): -6% year-over-year decrease
This year’s decline may reflect a market correction following the post-pandemic building surge and last year’s rebound. However, stable activity in Q2 suggests that the slowdown is not yet indicative of a sustained downturn.
County-Level Activity
When examining permit distribution by county, several patterns emerge:
Top Counties by Total Permits (YTD through Q2 2025):
- Gwinnett County – 1,642 permits | -31% YOY
- Cherokee County – 824 permits | -13% YOY
- Hall County – 770 permits | +12% YOY
- Fulton County – 753 permits | -17% YOY
- Forsyth County – 738 permits | -1% YOY
Gwinnett remains a regional leader in overall permit volume, though it has experienced a notable year-over-year decrease. Conversely, Hall County shows promising upward momentum with a 12% increase, highlighting it as a potential growth hub for the second half of the year.
Several counties appear to be solid performers so far in 2025, recording significant year-over-year increases:
- Barrow County – 572 permits | +66% YOY
- Douglas County – 413 permits | +18% YOY
- Carroll County – 315 permits | +20% YOY
The upward trends may possibly reflect shifting development patterns as buyers seek more affordable options outside of traditional high-growth corridors.
High-Value Residential Construction
New residential permits with values exceeding $500,000 are often used to gauge activity in the luxury or custom home sector. So far in 2025, this segment appears to be maintaining strength:
- Q1 2025: 885 high-value permits
- Q2 2025: 1,012 high-value permits
If this pace continues, the luxury market may surpass last year’s total of 2,865 high-value permits (full year), indicating ongoing demand for high-end construction despite broader market fluctuations.
Top Counties for High-Value Construction:
- Gwinnett County – 570 high-value permits (240 in Q1, 330 in Q2)
- Cherokee County – 304 permits (150 Q1, 154 Q2)
- Fulton County – 252 permits (114 Q1, 138 Q2)
- Cobb County – 196 permits (100 Q1, 96 Q2)
Gwinnett’s positioning in high-value activity reflects both its continued investment in upscale development and its status as a desirable location for custom builders.
Looking Ahead
While the 6 percent YTD decline suggests a slight contraction in residential construction, the numbers also indicate regional resilience and pockets of growth, particularly in high-end markets and outer suburban counties. With two quarters remaining, additional factors—such as interest rate shifts, land availability, and buyer confidence—will ultimately determine the shape of the 2025 market.
For contractors, developers, and suppliers, HBW’s mid-year construction data is an essential tool. It helps industry professionals respond to current conditions while preparing for the potential demands of Q3 and Q4.
Information utilized for the above listed figures for Metro Atlanta residential construction was directly derived from HBW construction data reports. To gain access to the HBW database and receive custom and detailed reports on the latest residential and commercial building activity in Florida, Georgia, Texas, Alabama, and Oklahoma, please contact HBW for details.
