
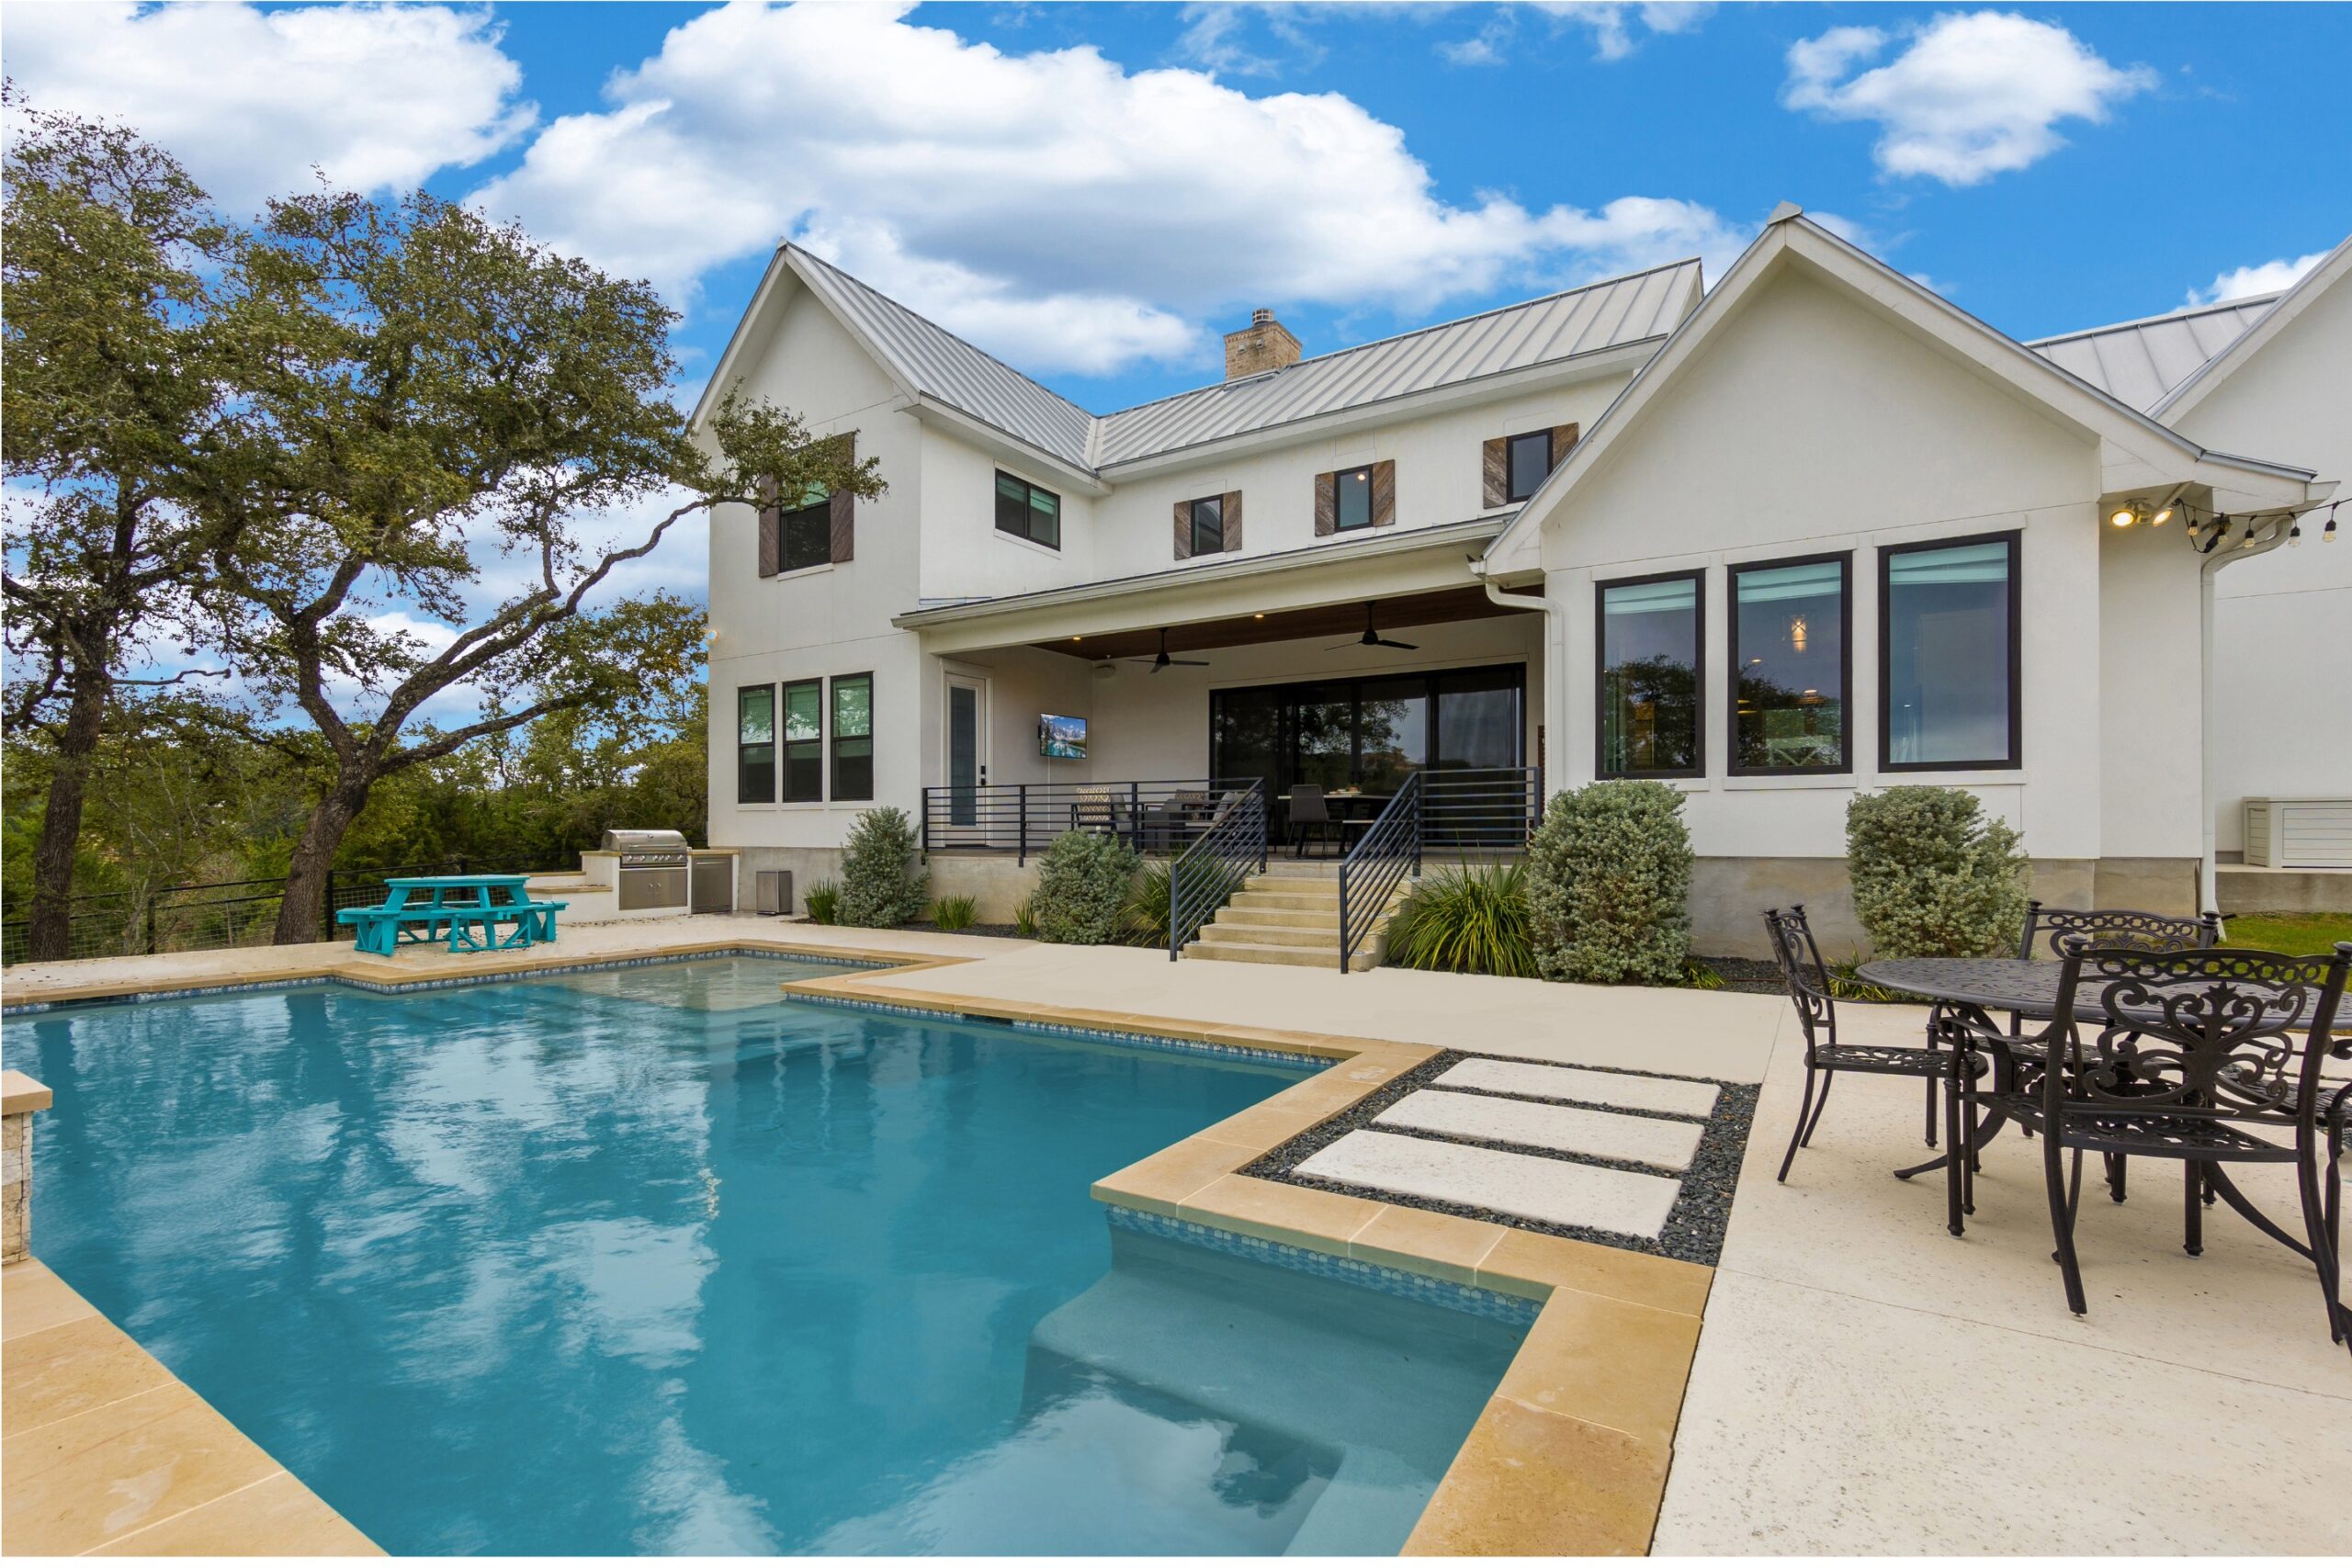
If you have spent any time in Texas during July, you know the heat doesn’t take a vacation, but according to the latest HBW construction data, new swimming pool construction certainly did. Last month, HBW recorded 443 new pool construction permits statewide (across the major metros of Dallas, Houston, Austin, and San Antonio) totaling approximately $34.8 million in new construction value; this reflects a 15% month‑over‑month decrease from June—proof that even in Texas, where summer feels like a year‑round sport, the market occasionally pauses to catch its breath.
Still, the regional breakdown reveals a story worth diving into. Let’s explore where the action happened, where it slowed, and what construction professionals should keep an eye on as we move deeper into Q3.
Dallas
Dallas didn’t just lead the pack—it practically cannonballed into the deep end last month.
- Total Permits: 225
- Total Value: $17,607,779
- Average Value: $78,257
- Leading Counties: Tarrant County (67 permits | Total Value: $5,777,969); Collin County (54 permits | Total Value: $3,482,608)
Dallas accounted for just over 50% of all new pool permits statewide, making it the undisputed heavyweight of July’s pool market. Tarrant County alone contributed nearly one‑third of the metro’s total activity, with Collin County not far behind. Despite its volume dominance, Dallas did not claim the highest average value—that honor belongs to Austin. But Dallas did deliver the largest overall construction value, reinforcing its role as one the state’s most robust pool‑building arena.
Houston
Houston posted a solid performance last month, though not at the scale seen in Dallas.
- Total Permits: 115
- Total Value: $9,190,000
- Average Value: $79,913
- Leading County: Harris County (81 permits | Total Value: $6,216,000)
Houston represented roughly 26% of statewide pool permits, with Harris County responsible for the lion’s share. The average value here edged slightly above Dallas, suggesting a healthy mix of mid‑range and premium pool projects.
Austin
While the Austin area may not have led in volume, it certainly led in average project value.
- Total Permits: 77
- Total Value: $6,461,581
- Average Value: $83,917
- Top County: Travis County (68 permits | Total Value: $5,610,561)
Austin posted the highest average value statewide, with projects averaging nearly $84,000; that’s a notable premium over Dallas and Houston, reflecting the region’s ongoing trend toward higher‑end residential amenities. The geographic concentration is also worth noting… Travis County accounted for nearly 90% of all Austin‑area pool permits. Next in line was Williamson County which contributed a modest 8 permits, making Austin a highly centralized market.
San Antonio
San Antonio rounded out the report with modest but consistent activity.
- Total Permits: 26
- Total Value: $1,576,000
- Average Value: $60,615
- Top County: Bexar County (19 permits | Total Value: $1,275,000)
San Antonio represented the smallest share of statewide permits—just under 6%. Bexar County dominated the metro’s activity, accounting for nearly 75% of all permits. With the lowest average value among the four metros, San Antonio’s July pool projects leaned toward more budget‑friendly builds. Still, the demand is steady, and the region continues to demonstrate fairly predictable seasonal patterns.
Statewide Insights
1. Dallas Dominates Volume – With 225 permits, Dallas contributed more than half of all new pool construction statewide. For builders, suppliers, and subcontractors, the Metroplex remains the most active and opportunity‑rich market.
2. Austin Leads in Average Value – Austin’s $83,917 average project value signals strong demand for premium residential amenities. High‑end builders and specialty subcontractors should keep a close eye on Travis County.
3. Houston Shows Balanced Strength – Houston’s mix of volume and value—plus its strong concentration in Harris County—makes it a somewhat stable market for pool construction professionals.
4. San Antonio Remains the Quietest Market – With the lowest permit count and lowest average value, San Antonio continues to be a smaller but steady contributor to statewide pool activity.
Permit data is more than just a monthly snapshot—it is a pulse check on consumer confidence, regional demand, and competitive positioning, and the figures from July paint a clear picture of how each Texas metro is behaving in the current market. Dallas stood out as the volume battleground, driving more than half of all new pool permits statewide, while Austin distinguished itself as the luxury market, posting the highest average project values of the month. Houston emerged as the balanced performer, offering a steady mix of permit volume and mid‑to‑upper‑range construction values. Meanwhile, San Antonio continued its role as the steady slow burn, contributing modest but consistent activity that rounds out the statewide view. For builders, this may be an opportune time to evaluate resource allocation, adjust marketing strategies, and anticipate where demand will likely rebound as temperatures—and homeowner ambitions—remain high.
And if you’re a pool builder in Texas, remember: Even when permits dip, the heat doesn’t. There is always another homeowner out there thinking, “Maybe it’s time for a pool.”
To gain more information on the builders, homeowners and permits for the construction activity above, check out HBW for your copy of the latest construction data reports. To gain access to the HBW database and receive custom and detailed reports on the latest residential and commercial building activity in Florida, Georgia, Texas, Alabama, and Oklahoma, please contact HBW for details.