HBW’s new swimming pool construction report for Florida in 2017
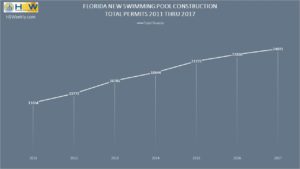
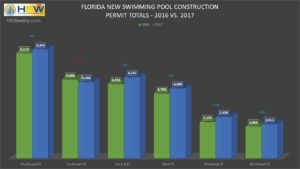
Out of the more than 24,000 swimming pool starts in Florida last year, the southwest region ranked #1 for total starts (6,350+ permits). Pool construction in the southwest has been growing over the last five years, and it continues to climb with 2017 reflecting a 4% year-over-year increase in permit activity for the area.
While there was a 6% year-over-year increase in new pool construction statewide last year, five out of six regions reviewed experienced notable growth. Northeast Florida had a healthy 14% increase in pool construction in comparison to 2016, and Central, West and Northwest Florida all experienced annual increases of 8% or so. Central Florida ranked second highest for total pool starts, continuing its growth pattern of the last five years, resulting in more than 4,700 new pools for the one-year period. Not far behind, the southeast region had a total of more than 4,450 pool starts, despite the annual dip (-3%) in new construction activity.
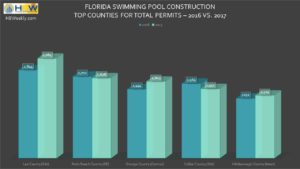
When reviewing counties for the greatest concentration of new pool construction, standouts included Lee in the southwest portion of the state (2,084 permits), Palm Beach to the southeast (1,676 permits) and Orange in Central Florida (1,603 permits). Out of the top five areas for new pool construction, Lee County reflected the highest level of growth with a 13% year-over-year increase in swimming pool permits. Here’s a closer look at the top counties for new pool construction last year:
To gain more information on the builders, homeowners and permits for the construction activity above, check out HBW for your copy of the latest construction data reports. To gain access to the HBW database and receive custom and detailed reports on the latest residential and commercial building activity in Florida, Georgia, Texas, Alabama, and Oklahoma, please contact HBW for details.


