
A review of the latest swimming pool permit data for Atlanta from January through June 2019
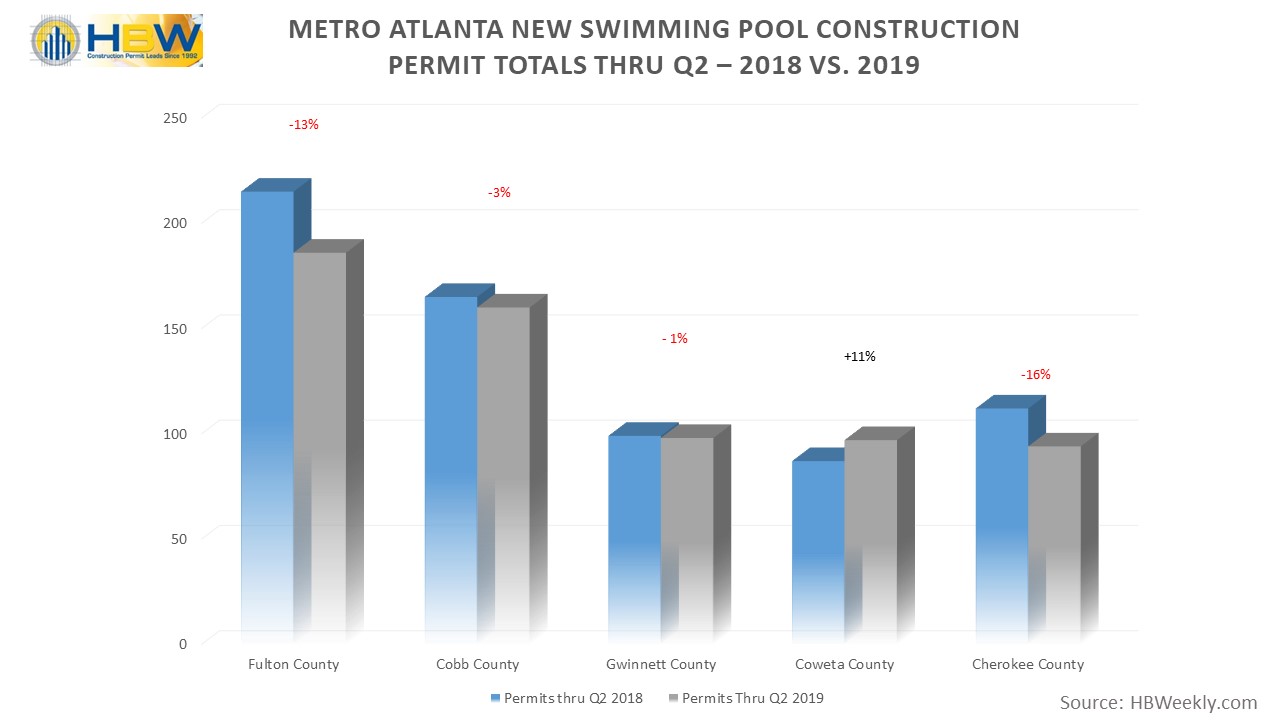
Atlanta Top Counties for Total New Swimming Pool Permits 2018 vs. 2019
In Atlanta, new swimming pool construction permits have been on the rise year after year. Since 2015, HBW has identified marked growth in swimming pool starts ranging from annual increases as low as 1 percent to as high as 18 percent every year. So far this year (Q2-2019), new swimming pool construction in Atlanta reflects a 3 percent year-over-year increase, resulting in 1,150 new permits.
For the purpose of HBW reports, the metro Atlanta area includes data from twenty-four counties. Based on HBW’s latest swimming pool construction activity trend report for the second quarter of this year, and as noted in the above listed graph, the counties with the highest concentration of new swimming pool construction include Fulton County (186 permits); Cobb County (160 permits); Gwinnett County (98 permits); Coweta County (97 permits); and Cherokee County (94 permits); all of the top listed counties are off to a slower start in new pool construction in comparison to the same time last year with the exception of Coweta County; new pools have been on the rise in Coweta for the last five years, and through the second quarter of this year, the area is already 11 percent ahead of figures from 2018.
Other counties that are exhibiting healthy growth in new pool construction but still hold lower concentrations of total permits include Hall County (36% year-over-year increase) and Forsyth County (31% year-over-year increase).
Information utilized for the above listed figures for Metro Atlanta residential construction was directly derived from HBW construction data reports. To gain access to the HBW database and receive custom and detailed reports on the latest residential and commercial building activity in Florida, Georgia, Texas, Alabama, and Oklahoma, please contact HBW for details.