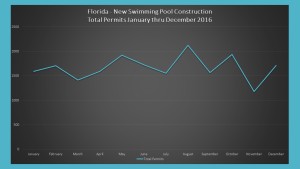
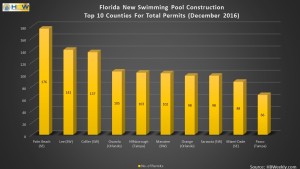
December was one of the top months for swimming pool construction in Florida, having experienced a 45% month-over-month increase.
The month of December was a busy one for swimming pool construction in Florida. From swimming pool builders leading each region to month-over-month increases of more than 50% in some areas, December proved to be a strong month for swimming pool builders in Florida.
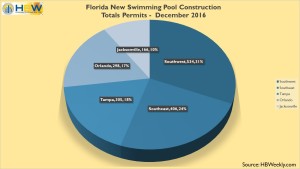
Although HBW subscribers can easily gain access to the permit data and details for the more than 1,700 pool starts and nearly $73M in construction value in December, we will take a look at some of the highlights of swimming pool construction in the Sunshine State. For starters, December ranked in the top five for total swimming pool starts out of all monthly periods in 2016. With a 45% increase in activity in comparison to November, every area throughout the state had a healthy boost in new pool construction. Southwest Florida experienced the greatest month-over-month increase (+66%) and ranked #1 for total pool starts with 534 permits and nearly $23.2M in total construction value; the southwestern counties with the most permits on file were Lee, Collier and Manatee.
Southeast Florida ranked second for both total pool starts and greatest increase in new pool construction last month. Out of the more than 400 new permits and approximately $18.2M in construction value, Palm Beach County had the greatest number of new pools (176 permits) in the area, while Miami-Dade County carried the highest average value for new pool construction at more than $56k.
Tampa also experienced a significant month-over-month increase (+30%) in swimming pool starts last month with more than 300 new permits and $13.6M in construction value added to the HBW database. Just as in residential construction, Hillsborough County had the greatest concentration of new permit activity in the area.
Not far behind, Orlando had a 25% increase in swimming pool starts since November with nearly 300 new construction permits totaling more than $11M in value. More than 68% of all new permits took place in the larger counties of Orange and Osceola.
Despite Jacksonville having the least amount of swimming pool starts, it was an improvement since November. In December, a 40% month-over-month increase in Jacksonville resulted in more than 165 new swimming pool construction permits with close to $6.6M in total value.
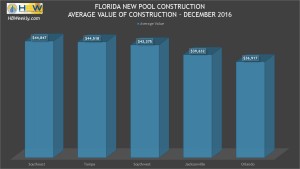
When looking at the average value of construction, there were no major shifts in any of the regions reviewed. In fact, the range in average value of construction is fairly tight across the state, with less than a $10k difference from highest to lowest. Southeast Florida maintained its lead at the top with an average value of $44,847 for swimming pool starts last month, while Orlando continued to hang at the lower end of the spectrum with an average value of $36,917. Tampa moved up two spots since November, ranking second highest for average value at $44,518.
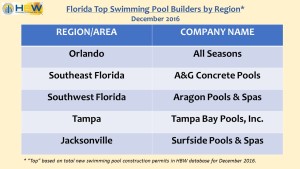
Out of the hundreds of active pool builders throughout the state last month, there were standouts in each region. Here’s a breakdown of the builders with the most pool starts on file in each region for December:
Just as there are top builders in each region, there are counties that experience more new construction than others. Last month, every area except Jacksonville had a county ranked in the top 10 for highest concentration of swimming pool starts. The listing is as follows:
Information utilized for the graphs and above listed figures for Florida swimming pool construction was directly derived from HBW construction data reports. To gain access to the HBW database and receive custom and detailed reports on the latest residential and commercial building activity in Florida, Georgia, Texas, Alabama, and Oklahoma, please contact HBW for details.

