
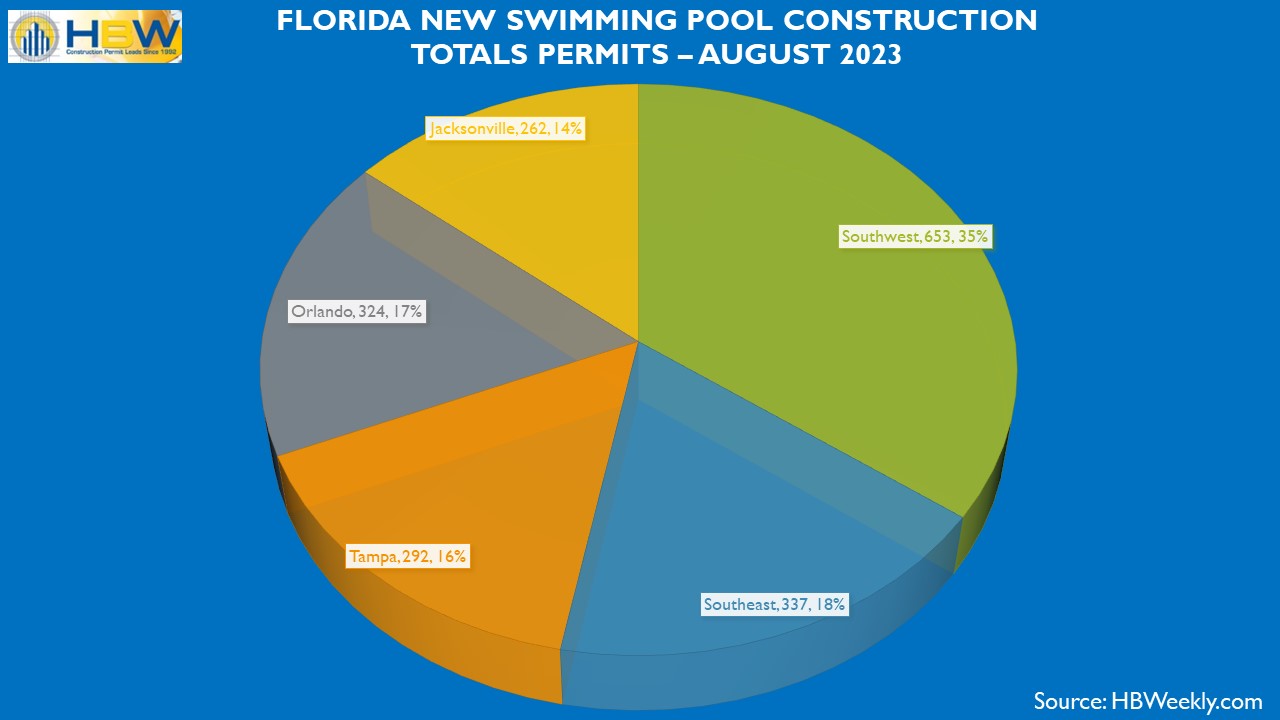
Based on HBW’s latest construction data reports, there were approximately 1,870 new swimming pool construction permits with a total value of nearly $147M on record for Florida last month; this reflects an 18 percent month-over-month decrease in new pool construction. Out of the five regions included in the reports (Southwest, Tampa, Orlando, Southeast, Jacksonville), the greatest volume of new pool construction activity could be found in the Southwest (653 permits), while the lowest level of new construction activity could be found in the Jacksonville area (262 permits).
When reviewing the reports to identify counties with the highest levels of new swimming pool construction, there were five counties that carried approximately 44 percent of all new construction activity statewide last month; those counties are as follows:
- Lee County (Southwest): 319 permits
- Palm Beach County (Southeast): 139 permits
- Orange County (Orlando): 135 permits
- Manatee County (Southwest): 114 permits
- St. Johns County (Jacksonville): 114 permits
As far as the average value of new pool construction permits is concerned, the average value ranged from a high of $89,038 (Jacksonville) to a low of $73,851 (Southwest). Here is a closer look at the average value of new pool construction by region last month (from highest to lowest):
- Jacksonville (average value: $89,038)
- Orlando (average value: $81,596)
- Tampa (average value: $78,060)
- Southeast (average value: $77,501)
- Southwest (average value: $73,851)
To gain more information on the builders, homeowners and permits for the construction activity above, check out HBW for your copy of the latest construction data reports. To gain access to the HBW database and receive custom and detailed reports on the latest residential and commercial building activity in Florida, Georgia, Texas, Alabama, and Oklahoma, please contact HBW for details.