
An overview of permit data for new swimming pool construction taking place in Florida during 2022
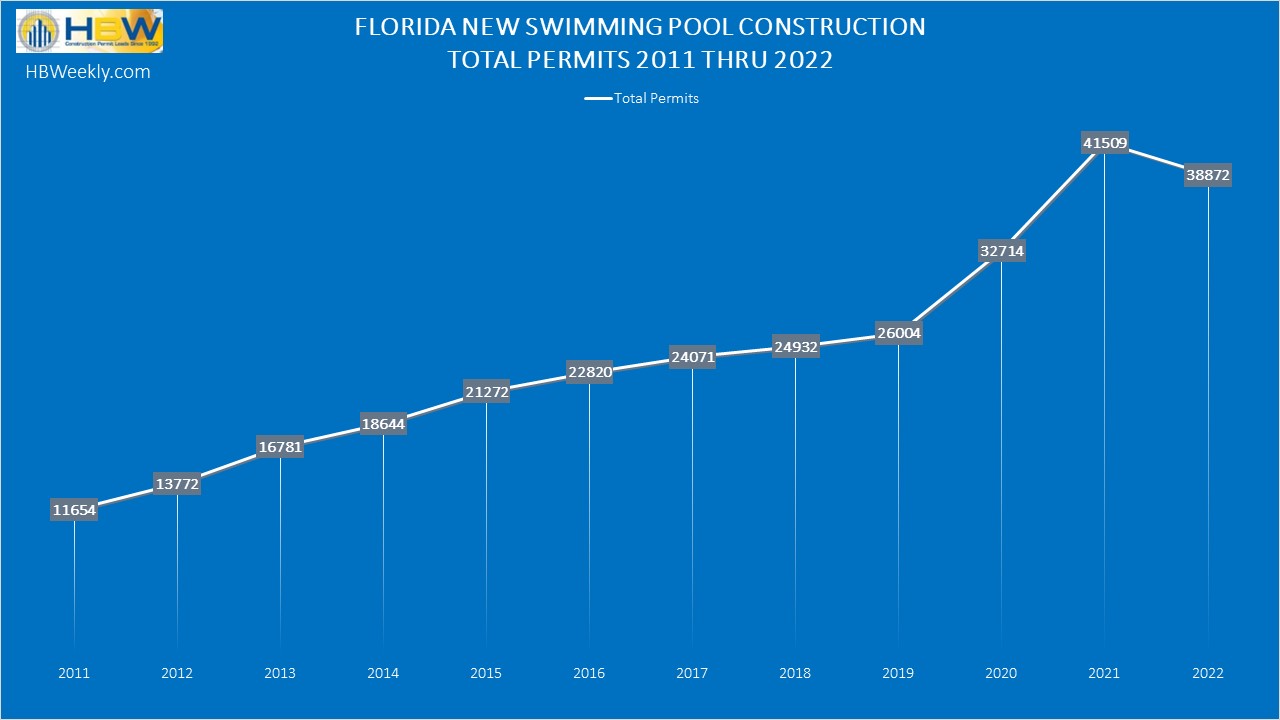
After several consecutive years of gaining upward momentum, new swimming pool construction appears to have slowed across the Sunshine State. Last year, there were more than 38,870 new swimming pool construction permits added to the HBW database for Florida, reflecting a 7 percent year-over-year decrease in new pool construction activity.
Out of the six regions that are included in the report (Southwest, Southeast, West, Central, Northeast, Northwest), the southwestern region (11,537 permits) carried the greatest concentration of new pool construction activity, while the lowest level of new construction could be found in the Northwest (3,425 permits). All regions, with the exception of the Northwest, demonstrated annual decreases in new construction ranging from -2 percent to -16 percent.
Here is a closer look at the total permits, leading counties, and annual % change in new pool construction across the state and by region:
Southwest
As previously noted, the highest concentration of new pool construction could be found in the southwestern region of the state where there was a 16 percent year-over-year decrease in new pool construction, resulting in 11,537 new permits for the year. Out of the five counties that make up the region, Lee County held the greatest volume of new permits (3,569 permits), while the fewest permits originated from Charlotte County (1,351 permits).
Southeast
Last year, there were 7,633 new permits added the the HBW database for the southeast, reflecting a 7 percent year-over-year decrease in new pool construction. Out of the seven counties included in the report for the area, more than 90 percent of all new construction could be found in Palm Beach (2,624 permits), Miami-Dade (1,827 permits), and Broward (1,263 permits).
West
In the western region of Florida, there were more than 6,900 new swimming pool permits added to the HBW database last year, reflecting a 2 percent year-over-year decrease in new pool construction. Out of the seven counties that make up the region, Hillsborough carried the highest concentration of new construction activity (2,021 permits) having experienced a 29 percent year-over-year increase in new pool construction.
Central
Last year, Central Florida demonstrated a 3 percent year-over-year decrease in new pool construction, resulting in nearly 5,490 new permits on record with HBW. Out of the six counties that make up the area, more than half of all new construction could be found in Orange (1,967 permits) and Brevard (1,101 permits).
Northeast
In the northeastern region of Florida, there were 3,885 new permits added to the HBW database for 2022, reflecting a stable market with little to no change from the previous year. Out of the eight counties that were included in the regional report, nearly 60 percent of all new pool construction could be found in St. Johns (1,448 permits) and Duval (773 permits).
Northwest
As previously noted, the northwestern region of the state experienced the lowest level (3,425 permits) of new pool construction last year; that being stated, it is the only area that demonstrated growth over the previous year, having a 4 percent year-over-year increase in new swimming pool construction permits. Out of the eighteen counties (16 FL counties and 2 AL counties) that were included in the regional report, nearly 55 percent of all new construction originated from the counties of Baldwin, AL (653 permits), Walton, FL (635 permits), and Santa Rosa, FL (532 permits).
To gain more information on the builders, homeowners and permits for the construction activity above, check out HBW for your copy of the latest construction data reports. To gain access to the HBW database and receive custom and detailed reports on the latest residential and commercial building activity in Florida, Georgia, Texas, Alabama, and Oklahoma, please contact HBW for details.