
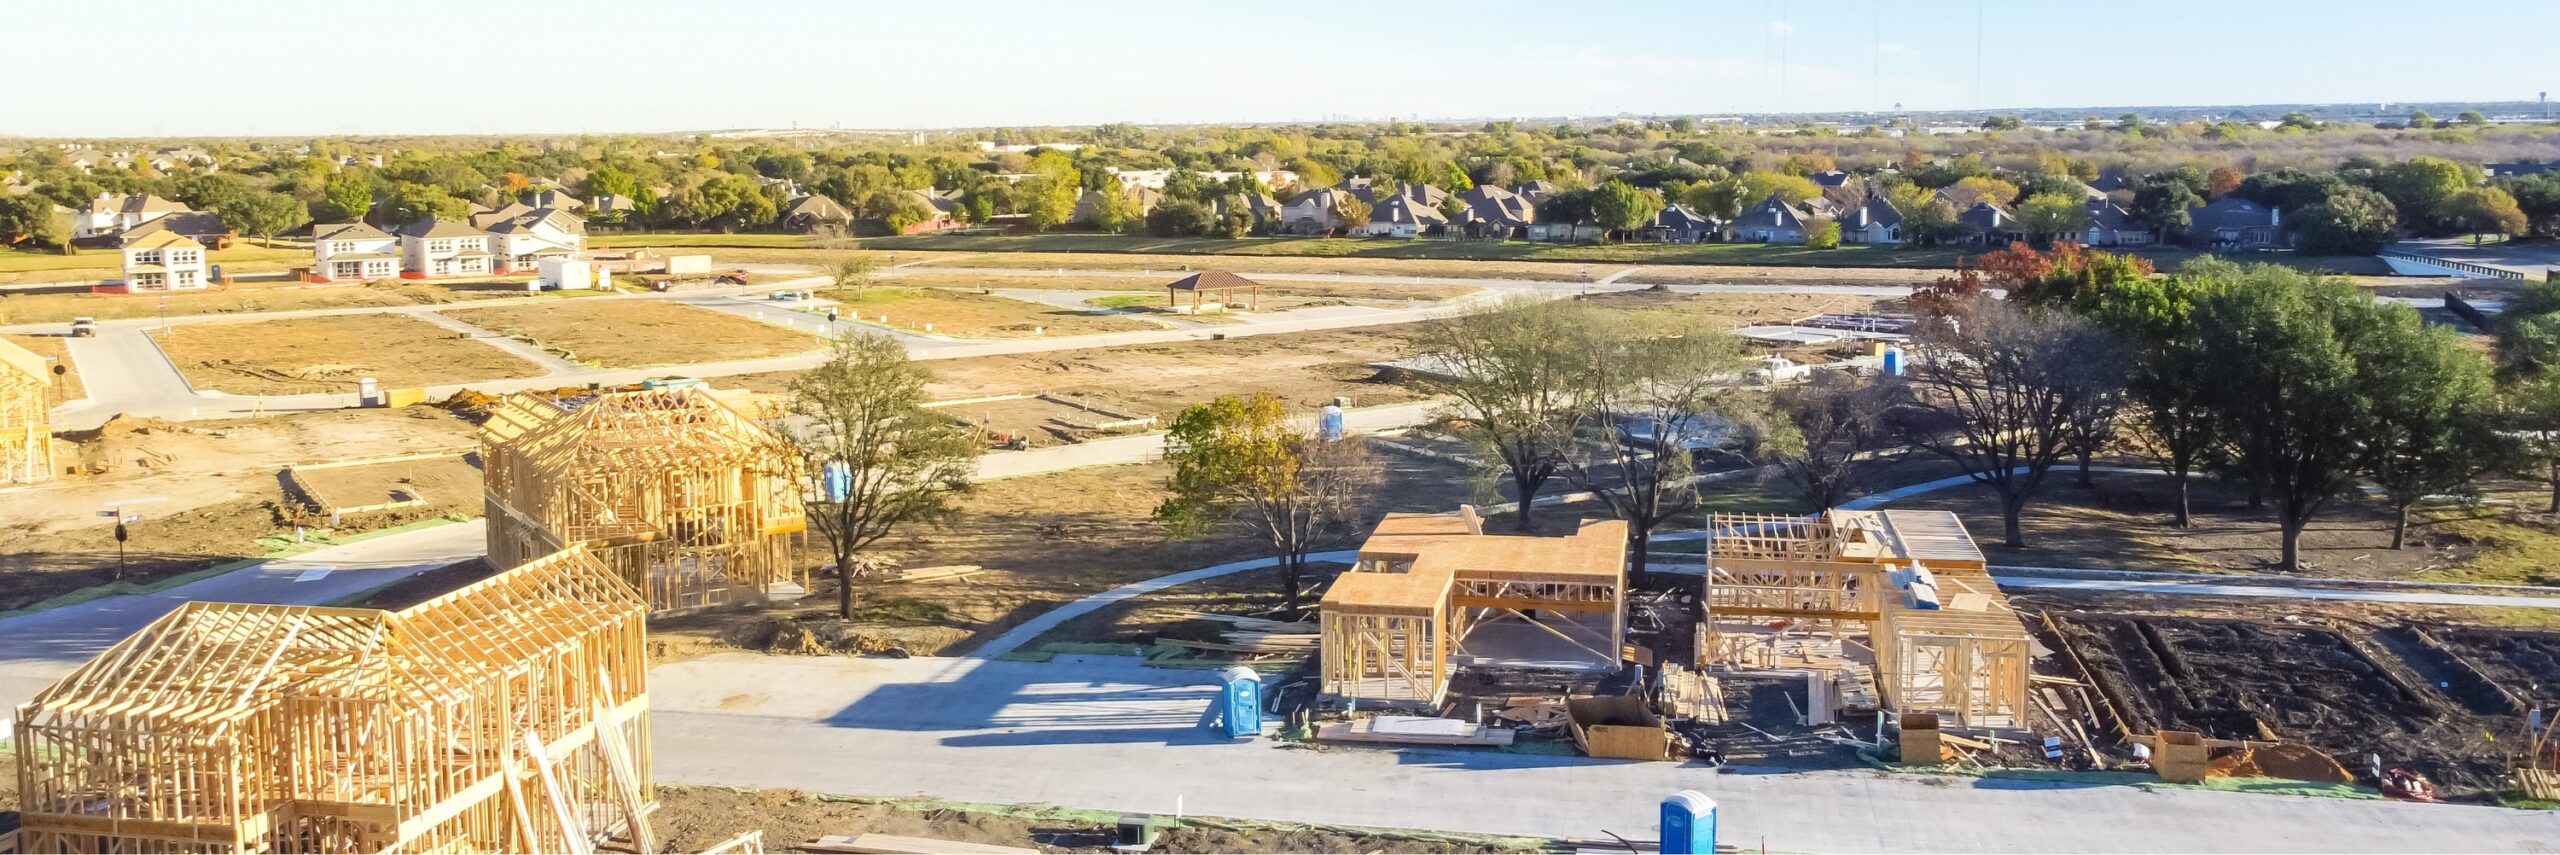
Through the second quarter of 2026, new residential construction activity across Texas continues to follow the deceleration pattern established last year—albeit with a few notable hotspots that seem determined to defy the statewide trend. According to the latest HBW Building Activity Trend Report, a total of 36,102 new residential construction permits have been added to the HBW database through Q2. This represents a 13% year‑over‑year decline, aligning closely with the statewide slowdown observed in 2025, when Texas posted a 9% decrease compared to 2024.
In other words, Texas homebuilding is still tapping the brakes—but not slamming them. And in true Texas fashion, some counties are ignoring the slowdown altogether and hitting the gas.
Houston: Still the Heavyweight, Even in a Downshift
Anyone familiar with HBW’s long‑running coverage knows that Houston is typically the state’s volume leader in residential construction. That trend continues in 2026, with the Houston metro area posting 16,899 new permits through Q2—the highest concentration of new residential construction activity in Texas. This figure reflects a 15% year‑to‑date decline compared to the same period in 2025, slightly steeper than last year’s 10% drop versus 2024. While the overall metro is trending downward, several counties inside the region are staging their own counter‑movements:
- Galveston County: 1,062 permits, marking a 41% year‑over‑year increase. A surge of this magnitude—especially following last year’s decline—makes Galveston one of the most notable hotspots in the state so far this year.
- Fort Bend County: 3,380 permits, up 16% year‑to‑date. Fort Bend is showing sustained momentum, suggesting strong demand and ongoing development pressure.
- Brazoria County: 1,193 permits, also up more than 16% compared to 2025. Another county that declined last year but is now pushing upward.
The above listed counties collectively demonstrate that even in a cooling market, localized demand drivers can create pockets of accelerated activity. Meanwhile, the two counties with the highest overall permit volume in the Houston area are moving in the opposite direction:
- Harris County: 6,325 permits, down 31% year‑to‑date.
- Montgomery County: 4,939 permits, down more than 17%.
The contrast between these high‑volume counties and the rising outliers underscores the importance of granular market monitoring. Statewide trends tell one story; county‑level permitting tells another.
Dallas: Solid Volume, Mixed Momentum
Dallas ranks second statewide for total new residential construction activity, with 11,649 permits added through Q2. This represents a 17% year‑over‑year decline, placing Dallas slightly deeper into contraction than Houston on a percentage basis. Yet, as with Houston, the Dallas metro is far from uniform:
- Tarrant County: 4,624 permits, posting a 35% year‑to‑date increase. This is one of the strongest growth rates in the entire state and a sharp contrast to the metro’s overall decline.
- Collin County: 3,386 permits, reflecting a 36% decrease compared to 2025. Collin’s downturn is significant, but it is also following a previous year of decline so this level of activity doesn’t come as a major surprise.
- Ellis County: 1,103 permits, up nearly 11% year‑to‑date. Ellis also posted a 12% increase last year, making this two consecutive years of upward movement—an important signal of stabilization and sustained demand.
Dallas continues to be a tale of two markets: some counties accelerating, others decelerating, and all contributing to a metro area that remains a major construction hub despite its overall slowdown.
Austin: The Lone Metro Bucking the Trend
Austin is the only major Texas metro showing a year‑to‑date increase in new residential construction activity. Through Q2, the region added 4,391 permits, marking a 12% rise compared to 2025. This upward movement is driven primarily by a bump in Travis County, as well as some moderation in Williamson:
- Travis County: 2,214 permits, up a remarkable 38% year‑to‑date. This is one of the most substantial county‑level spikes in the entire state.
- Williamson County: 1,527 permits, down about 3% year‑over‑year. A modest decline, but not enough to offset Travis County’s surge.
Austin’s growth suggests that demand for new housing remains strong. The region’s tech‑driven economy and ongoing population inflows continue to support elevated permitting activity.
San Antonio: Declining Overall, With a Dash of Stability
San Antonio posted 3,163 permits through Q2, reflecting a 15% year‑over‑year decrease, which aligns closely with the statewide trend.
Key county‑level details include:
- Bexar County: 2,004 permits, down 21% year‑to‑date.
- Comal County: 464 permits, up 2% compared to 2025. Comal’s increase is modest, but given its multi‑year decline, this may represent a stabilization point rather than a true spike. The remainder of 2026 will determine whether this is a plateau or the beginning of a turnaround for this county.
Higher‑Value Residential Construction ($500K+)
When examining higher‑value residential construction—homes valued at over $500,000—Dallas leads the state:
- Dallas Metro – There was a total of 2,047 higher value permits through mid‑year. With 5,665 higher‑value permits recorded in 2025, the current trajectory suggests Dallas may finish 2026 slightly below last year’s total unless activity accelerates in the second half.
Houston follows:
- Houston Metro – Through the second quarter of this year, there have been 1,039 higher value permits added to the HBW database for Houston. With 2,086 higher‑value permits recorded in 2025, Houston appears positioned to match—or potentially exceed—last year’s performance.
The “higher value” segment is showing signs of moderation, not retreat. Higher‑value construction tends to be less sensitive to short‑term market fluctuations, and 2026 is reinforcing that pattern.
Texas residential construction in 2026 is best described as a market in controlled deceleration. Statewide permitting is down, three of the four major metros are contracting, and higher‑value construction is moving at a slightly slower clip. And while statewide residential construction appears to be trending downward so far this year, the story is far from uniform. Houston continues to lead the state in overall permit volume, while Dallas remains a major producer of new construction despite its mixed county‑level performance. Austin stands out as the only metro posting a mid‑year increase, and San Antonio, though experiencing a decline, is showing some possible and early signs of stabilization in certain areas thanks to steady activity in Comal County. Meanwhile, several counties—including Galveston, Fort Bend, Brazoria, Tarrant, and Travis—are generating notable spikes in permitting that run counter to the broader slowdown, underscoring the highly localized nature of construction demand across Texas.
As always, Texas construction is dynamic, regionally diverse, and occasionally unpredictable. The second half of 2026 will determine whether some of the hotspots represent temporary surges or the early stages of a broader market shift. And if history is any guide, Texas will continue to keep analysts, builders, and market watchers on their toes (boots optional).
To gain more information on the builders, homeowners and permits for the construction activity above, check out HBW for your copy of the latest construction data reports. To gain access to the HBW database and receive custom and detailed reports on the latest residential and commercial building activity in Florida, Georgia, Texas, Alabama, and Oklahoma, please contact HBW for details.