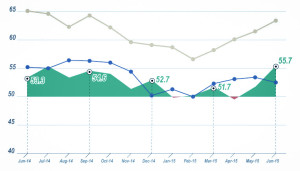
This Summer (June), Architecture Billings Index (ABI) jumped to it highest point since 2007.
If you are receiving reports and permitting data from HBW, you are already aware of the number and type of construction permits that are being pulled this summer. That being stated, by taking a look at the ABI (Architecture Billings Index) you may also gain some useful insight on nonresidential construction coming “down the pipe”. The ABI is derived from a monthly survey conducted by AIA Economics Market and Research group and serves as an economic indicator for nonresidential construction activity by 9-12 months.
The ABI Report for June proved to be promising for the construction industry. From a national perspective, Architecture billings surged… In June, the Architecture Billings Index (ABI) reported its highest score, 55.7, since 2007 which was welcome news in a year that has shown a varying “up and down” cycle; such an increase in architectural and design services, along with recent construction spending and increased employment figures, are strong indicators for a solid year (2015) for the commercial construction industry.
Blue=Design Contracts Gray=Inquiries Green=Billings
The construction sector has added about 140,000 jobs on net as of the closing of June 2015. This resulted in a decreased unemployment rate of 6.3% in June from a rate of 8.2% one year prior. July 2015 has reflected a continued drop in unemployment in the construction industry with a rate of 5.5%. (Source: Bureau of Labor Statistics)
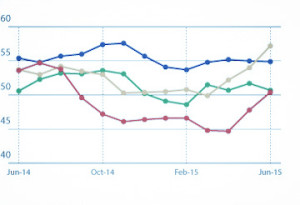
From June 2014 through June 2015, there has been consistent growth across all regions with firms reporting increased billings throughout the Midwest, Northeast, South and West.
With ABI, 50 represents the diffusion center. A score of 50 equals no change. A score above 50 shows increase.
South (Blue)=54.9 West (Green)=50.7 Northeast (Red)=50.4 Midwest (Gray)=57.2
In the last 12 months, there has been no shortage in extreme weather conditions throughout the nation. Although such weather conditions have stalled various new construction projects, changes in weather have also increased construction for a number of firms. On average, there has been an increase of nearly 4% in new work as a result of extreme environmental conditions, with the Northeast showing the highest increase at 9.4%.
Despite the decrease in Multi-family Residential (47.0), all sectors were above 50 for June. The highest demand was reported for Institutional (59.1) and Mixed Practice (54.7) design services. Commercial/Industrial (51.6) finally experienced an increase in activity after two consecutive months of decline.
For more specific activity on construction activity in your area, check out HBW for your next report. Follow our blog for continued and expanded reporting on industry activity and trends.


