
Earlier this week, NOAA reported that most of the United States will be faced with one hot summer. The report indicated an expectation of well above average summer temperatures, according to the latest outlook from NOAA’s Climate Prediction Center, which means temperatures in the warmest third of all summers in the current record (1981-2010). (source: climate.gov). With already warmer temperatures in Florida, it is the ideal time for consumers to consider pool construction before the real heat sets in. Although most will plan ahead, there was certainly no shortage in pool construction across Florida in recent months. From Jacksonville to South Florida and major cities in between, Florida had nearly 1,600 swimming pool starts in April and more than $66.2M in total construction value.
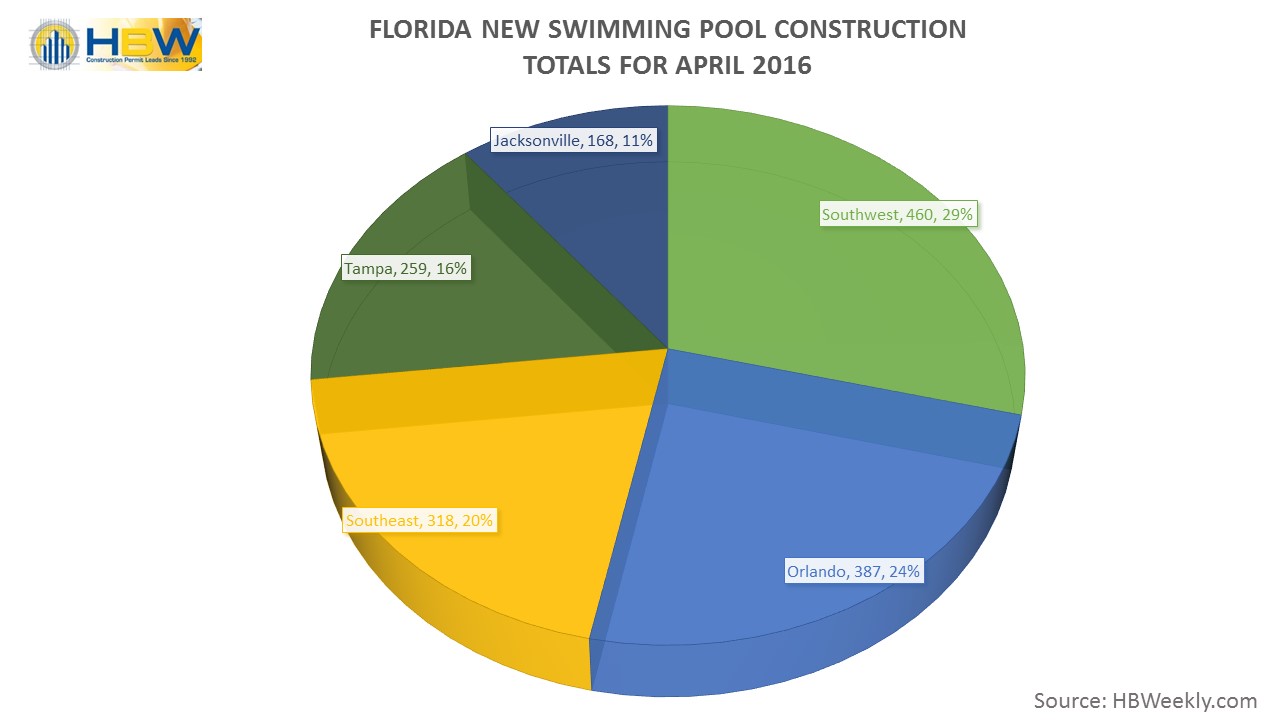
Florida Pool Permit Totals by Area – April 2016
Based on reports from the HBW database, more than 50% of new swimming pool construction in Florida last month took place in the southwest and central (Orlando) regions of the state. Southwest Florida was in the lead for total swimming pool starts with 460 permits on file and nearly $18.8M in total construction value. The second highest for pool construction was the Orlando area with 387 new permits in April and a total value close to $15M. Although Southeast Florida was third for total permits (318 permits), it was second highest for total value with more than $15.1M in new construction for the month. Tampa and Jacksonville came in at fourth and fifth for the month with 259 new permits (total value: $10.1M+) in Tampa and 168 new permits (total value: $7.1M+) in Jacksonville.
From a county perspective, and as one may expect, all of the top five counties for total new permits were in the southwest and central regions of the state. Lee (SW) County was #1 for total starts with 150 new permits and more than $6.1M on file with HBW for the month. Also in the southwest portion of the state, Collier County was second highest with 130 starts and nearly $5.7M in total construction value. Orlando continued to hold strong last month with 118 new swimming pool permits on file and close to $5.3M in total value. In at #4 and #5 we have Manatee (SW) and Brevard (Orlando) counties which had 113 and 112 swimming pool starts respectively.
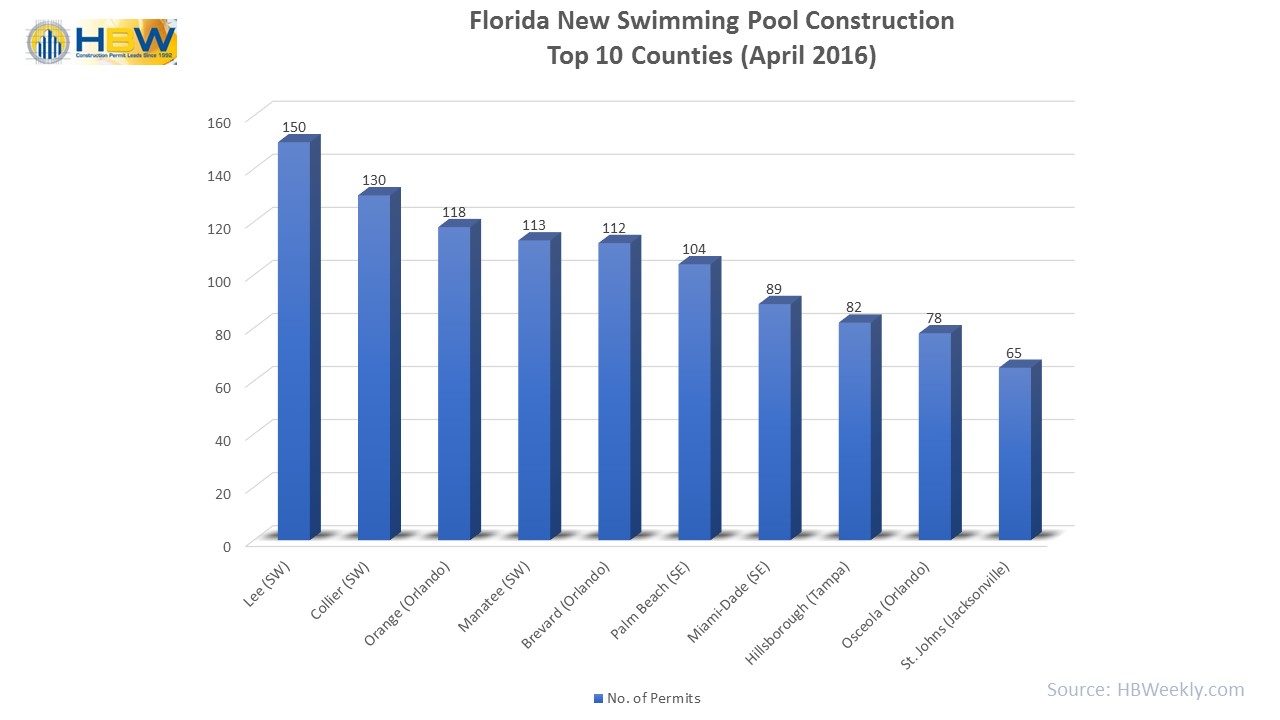
FL Pool Permits by Top Counties – April 2016
As for average value of pools constructed in Florida last month, the southeast region of the state pushed up to #1. In the first quarter of the year, Jacksonville had maintained the highest average value of the five areas reviewed, but at the start of Q2, swimming pool construction in Miami-Dade and Palm Beach counties are pushing totals and values in the southeast. The average value of pools constructed in SE Florida last month was $47,703. Jacksonville is second highest for average value with $42,387. Southwest Florida came in third with an average value of $40,849. Here is a look at the average value of swimming pool construction across the state:
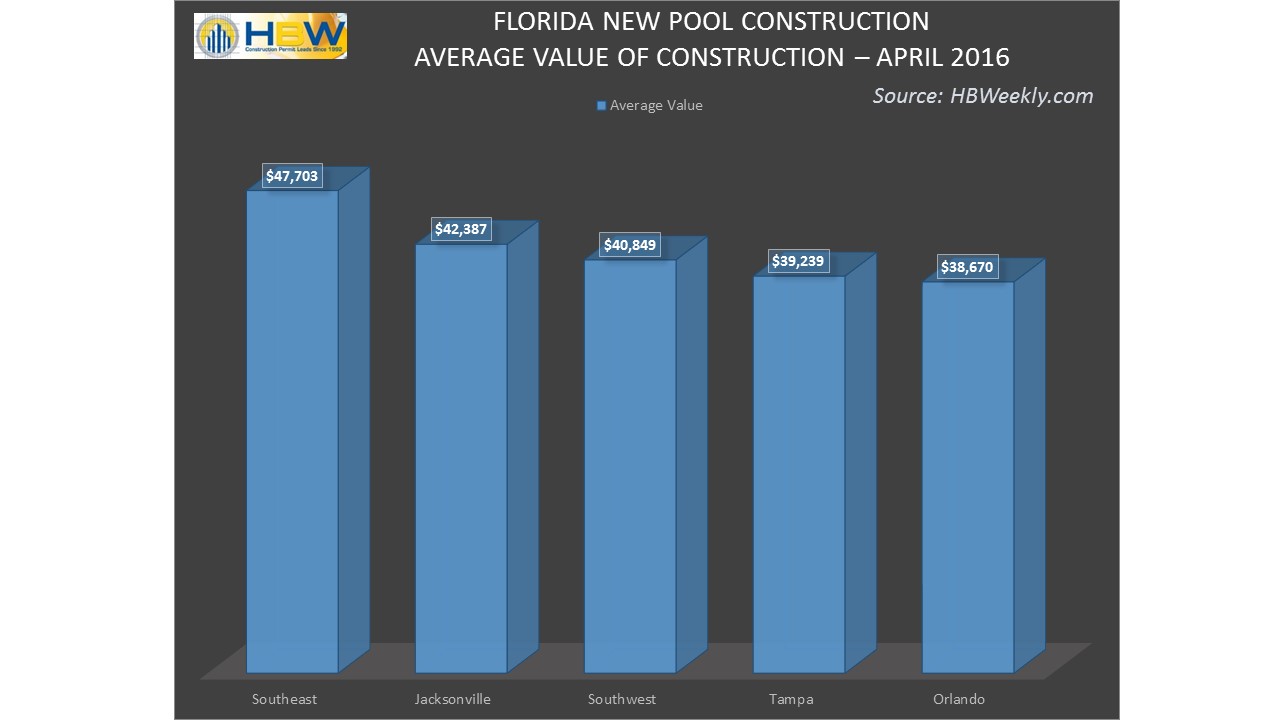
FL – Average Value of Pool Construction April 2016
Information utilized for the graphs and above listed figures was directly derived from HBW construction data reports. To gain access to the HBW database and receive custom and detailed reports on the latest residential and commercial building activity in Florida, Georgia, Texas, Alabama, and Oklahoma, please contact HBW for details.