
A review of permit data on record with HBW for new swimming pool construction in Florida during the month of January 2021
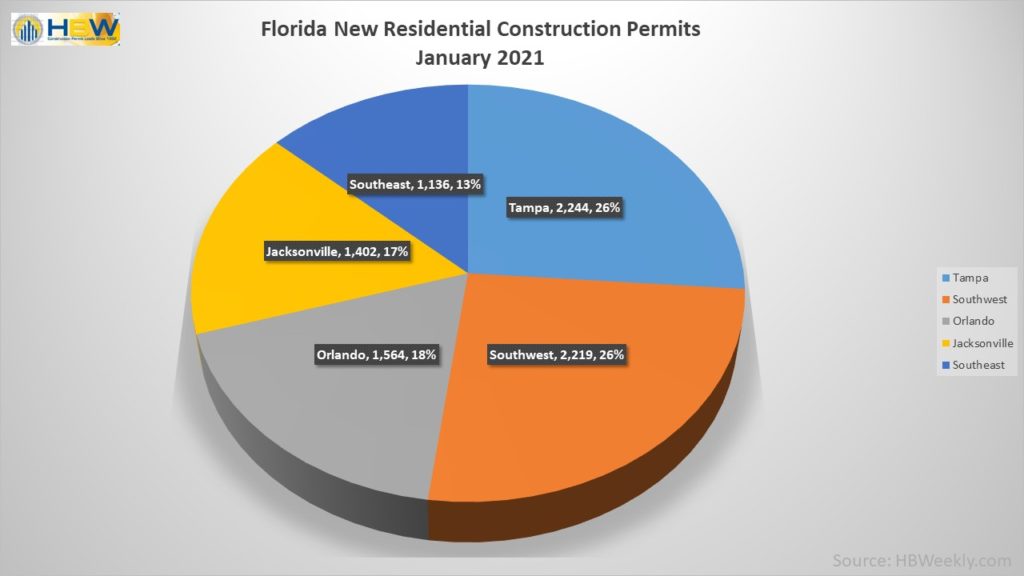
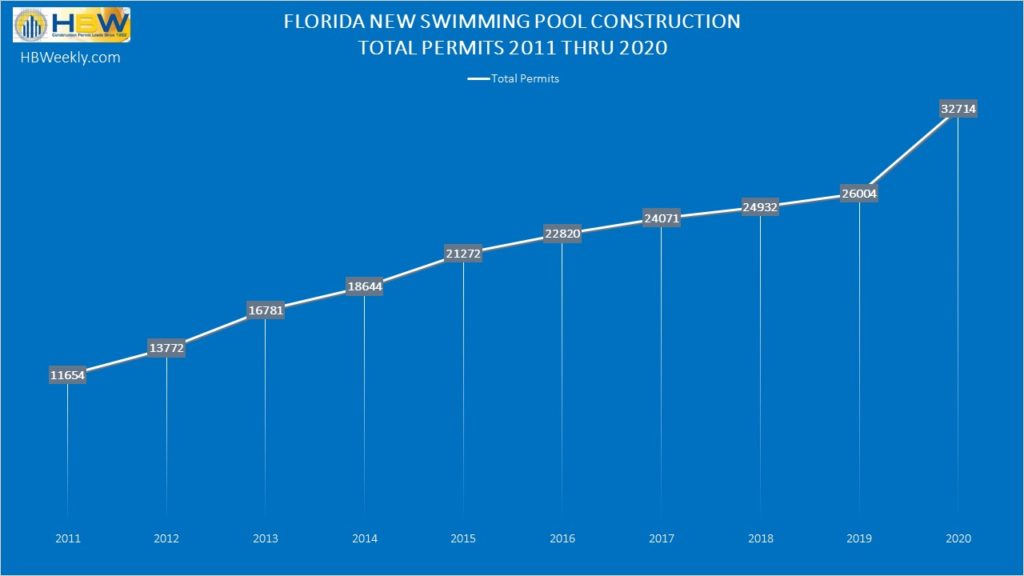
So far this year (January 2021), Florida has exhibited a strong start to new swimming pool construction. Based on HBW’s latest construction data reports, Florida experienced a 20 percent month-over-month increase in new pool construction, resulting in nearly 2,900 new permits on record with HBW for the one-month period.
Out of the five Florida regions reviewed (Southwest, Tampa, Orlando, Southeast, Jacksonville), the greatest concentration of new pool construction took place in Tampa (971 permits), while the highest average value of pool starts could be found in Jacksonville (average value: $60,957).
Here is a closer look at the total number of new permits, leading counties and average value of construction for new swimming pools in Florida during the month of January 2021:
Southwest
Total # of Permits: 971
Average Value of Construction: $44,845
Leading Counties (based on total permits): Lee (258 permits), Sarasota (222 permits)
Top pool builders (based on total permits):
| Builder |
| 1-Coast to Coast Pools |
| 2-Pinnacle USA |
| 3-Aragon Pools & Spas |
Tampa
Total # of Permits: 568
Average Value of Construction: $56,991
Leading Counties (based on total permits): Hillsborough (168 permits), Pasco (148 permits)
Top pool builders (based on total permits):
| Builder |
| 1-Challenger Pools |
| 2-Trendsetter Pools |
| 3-Gulfstream Pools & Spas |
Orlando
Total # of Permits: 486
Average Value of Construction: $47,893
Leading Counties (based on total permits): Orange (213 permits), Brevard (94 permits)
Top pool builders (based on total permits):
| Builder |
| 1-Dreamscapes Pools & Spas |
| 2-American Pools & Spas |
| 3-Martin Pools |
Southeast
Total # of Permits: 586
Average Value of Construction: $45,388
Leading Counties (based on total permits): Palm Beach (269 permits), Miami-Dade (141 permits)
Top pool builders (based on total permits):
| Builder |
| 1-A&G Concrete Pools |
| 2-Champion Pools & Spas |
| 3-Swimming Pool Contractors |
Jacksonville
Total # of Permits: 286
Average Value of Construction: $60,957
Leading County (based on total permits): St. Johns (155 permits)
Top pool builders (based on total permits):
| Builder |
| 1-Pools by John Clarkson |
| 2-Builders Source |
| 3-Tier 1 Pools and Spas |
To gain more information on the builders, homeowners and permits for the construction activity above, check out HBW for your copy of the latest construction data reports. To gain access to the HBW database and receive custom and detailed reports on the latest residential and commercial building activity in Florida, Georgia, Texas, Alabama, and Oklahoma, please contact HBW for details.


