Texas Top Home Builders – January 2020

A list of the top home builders in Texas, based on new permit data for the month of January 2020

Earlier this week, we reviewed new residential construction permit data on record with HBW for Texas during the month of January 2020.  As previously published, there were approximately 5,850 new residential construction permits with a total value of nearly $1.4 billion added to the HBW database last month.  Out of the hundreds of leading home builders with housing starts on record in the Lone Star State, there were two major players who landed on the leader board in nearly all metro areas reviewed…

D.R. Horton led Texas metro areas, having approximately 980 new residential construction permits on record for the month and ranking #1 in three (Houston, Dallas, Austin) out of the four areas reviewed.  Following D.R. Horton, Lennar Homes led in San Antonio and landed #2 in all other areas reviewed, having more than 435 new residential construction permits on file statewide for the one-month period.

Here is a closer look at the leading builders (by metro area) with the greatest concentration of new residential construction permits on record in Texas during the month of January 2020:

Houston

In Houston, there were nearly 285 home builders with housing starts on record for the month of January, and the following ranked as the top five for total new permits on record with HBW:

Builder Total Permits
D.R. Horton 382
Lennar Homes 176
Perry Homes 154
K Hovnanian Homes 148
KB Homes 94


Dallas

In Dallas, there were 215 home builders with housing start on record last month, and the following ranked as the top five for total new residential construction permits for the one-month period:

Builder Total Permits
D.R. Horton 468
Lennar Homes 79
Highland Homes 70
First Texas Homes 63
Pulte Homes 54


Austin

Last month, there were 115 home builders with new residential construction permits on record in the Austin area, and the following ranked as the top five for total new permits for the one-month period:

Builder Total Permits
D.R. Horton 128
Lennar Homes 107
Pulte Homes 63
KB Homes 56
Meritage Homes 41


San Antonio

Out of the 65 active home builders with new construction activity in the San Antonio area last month, the following ranked as the top five for total new permits on record with HBW:

Builder Total Permits
Lennar Homes 74
Continental Homes of Texas 57
Meritage Homes 35
Pulte Homes 28
KB Homes 26


To gain more information on the builders, homeowners and permits for the construction activity above, check out HBW for your copy of the latest construction data reports. To gain access to the HBW database and receive custom and detailed reports on the latest residential and commercial building activity in Florida, Georgia, Texas, Alabama, and Oklahoma, please contact HBW for details.

Texas Residential Construction Review – January 2020

An overview of new construction data on record with HBW for new home construction in Texas

In the first month of 2020, there have already been approximately 5,850 new residential construction permits with a total value of nearly $1.4 billion added to the HBW database for Texas.  Out of the four major metro areas reviewed (Dallas, Houston, Austin, San Antonio), Houston (2,515 permits) held the highest concentration of new permits in January, while Dallas has and continues to hold the highest average value of new home construction (average value: $268,749).

Here is a closer look at the total permits, average value and leading counties for new residential construction in Texas during the month of January 2020:

Houston

Last month, Houston led Texas for new home construction, having 2,515 housing starts with a total construction value of approximately $491 million on record.  The average value of new residential construction was lowest in Houston in comparison to other areas reviewed (average value: $195,209), and nearly half of all new permits originated from Harris County (1,106 permits).

Dallas

Dallas ranked second for new home construction having 1,960 housing starts with a total construction value of nearly $527 million last month.  As previously mentioned, the average value of construction was highest in Dallas (average value: $268,749) in comparison to other Texas metro areas reviewed, and the county with greatest concentration of new home construction activity was Tarrant County with approximately 790 housing starts on record for the one-month period.

Austin

In Austin, there were 925 housing starts with a total construction value of nearly $236 million last month.  The average value of construction landed on the higher end of the spectrum in comparison to other areas reviewed (average value: $254,883), and more than half of all new permits in the Austin area originated from Travis County (516 permits).

San Antonio

In the San Antonio area, there were approximately 450 housing starts with a total construction value of nearly $109 million last month.  The average value of construction was $242,583, and the majority of new permits originated from the County of Bexar (~300 permits).

To gain more information on the builders, homeowners and permits for the construction activity above, check out HBW for your copy of the latest construction data reports. To gain access to the HBW database and receive custom and detailed reports on the latest residential and commercial building activity in Florida, Georgia, Texas, Alabama, and Oklahoma, please contact HBW for details.
Florida Residential Construction Report – 2019

An overview of Florida permit data for new home construction in 2019

Residential construction has been booming in Florida for years.  According to HBW records, the market has been on an upward trajectory since 2011, reflecting annual increases as high as 16 percent or more.  While the residential construction industry is still growing in the Sunshine State, last year showed signs of slowing in the rate of growth.  From January 1st to December 31, 2019, there was a 2 percent year-over-year increase in new home construction in Florida, resulting in 84,500 new permits on record with HBW.

Out of the six major regions reviewed (Northwest, Northeast, Southwest, Southeast, West, Central), the two areas that exhibited growth in residential construction were the northwestern and western portions of the state with year-over-year increases of 7 percent and 16 percent respectively.  The areas with the highest concentration of new permits on record for the one-year period include West Florida (20,110 permits) and Southwest Florida (15,738 permits).

Here is a breakdown of the total residential construction permits, annual comparisons and leading counties by Florida region in 2019:

West Florida

Total permits: 20,110

% change in total permits (in comparison to 2018): +16 percent

Top county for total permits: Hillsborough (5,945 permits)

Percentage of Permits representing “high value” (>$500k) properties: 5 percent


Southwest Florida

Total permits: 15,738

% change in total permits (in comparison to 2018): N/A

Top county for total permits: Lee County (4,668 permits)

Percentage of Permits representing “high value” (>$500k) properties: 4 percent


Northeast Florida

Total permits: 13,872

% change in total permits (in comparison to 2018): -5 percent

Top county for total permits: Duval County (4,155 permits)

Percentage of Permits representing “high value” (>$500k) properties: 3 percent


Central Florida

Total permits: 13,866

% change in total permits (in comparison to 2018): -8 percent

Top county for total permits: Orange County (4,988 permits)

Percentage of Permits representing “high value” (>$500k) properties: 8 percent


Northwest Florida

Total permits: 11,086

% change in total permits (in comparison to 2018): 7 percent

Top county for total permits: Santa Rosa (1,551 permits)

Percentage of Permits representing “high value” (>$500k) properties: 5 percent


Southeast Florida

Total permits: 9,828

% change in total permits (in comparison to 2018): -1 percent

Top county for total permits: St. Lucie (3,451 permits)

Percentage of Permits representing “high value” (>$500k) properties: ~10 percent

To gain more information on the builders, homeowners and permits for the construction activity above, check out HBW for your copy of the latest construction data reports. To gain access to the HBW database and receive custom and detailed reports on the latest residential and commercial building activity in Florida, Georgia, Texas, Alabama, and Oklahoma, please contact HBW for details.
Annual Review – Florida Swimming Pool Construction 2019

An HBW report on new swimming pool construction permits in Florida from January 1st through December 31, 2019

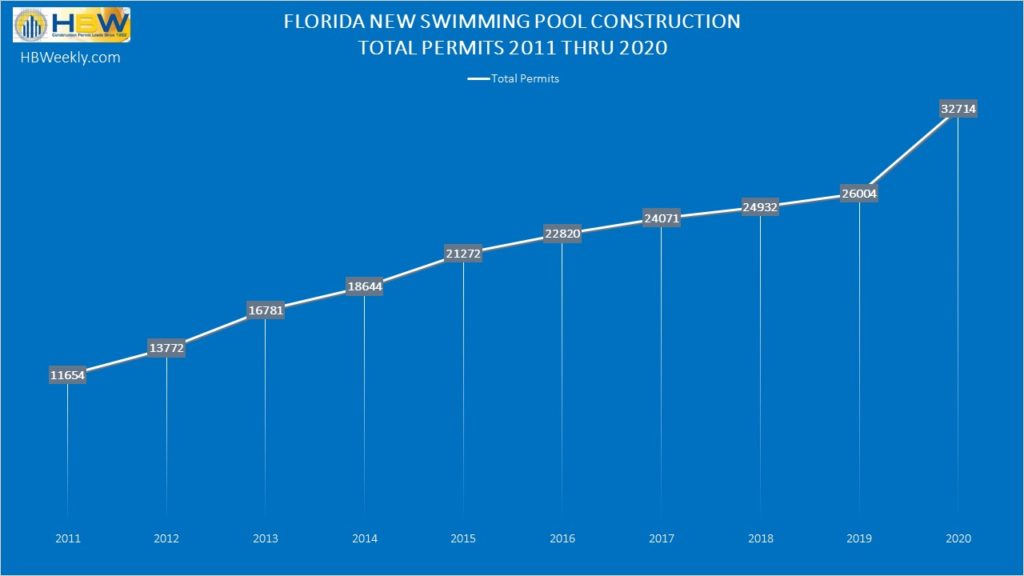
In Florida, new swimming pool construction is on the rise.  According to HBW’s latest Swimming Pool Construction Activity Trend Report, the Sunshine State experienced a 5 percent year-over-year increase in new swimming pool permits in 2019, resulting in more than 26,000 new permits on record with HBW.

This growth pattern is not new – Since 2011, swimming pool construction has been steadily climbing year after year in Florida, with annual increases ranging from 4 percent (2018) to as high as 14 percent (2015).  Last year, four out of the six major Florida regions reviewed (Central, West, Southeast, Southwest, Northeast, Northwest) experienced annual spikes in new pool construction, with the greatest increase in new pool permits taking place in Northwest Florida (+13%) and the highest concentration of new permits originating from Southwest Florida (7,045 permits).

Here is a closer look at swimming pool construction permit data on record with HBW for Florida last year:

Southwest Florida

In comparison to other regions reviewed, the southwestern region of Florida carried the greatest total amount of pool starts last year, having 7,045 new permits on record and reflecting a 7 percent year-over-year increase in new swimming pool construction.  More than half of all new construction took place in the counties of Lee (2,137 permits) and Collier (1,553 permits), with both counties demonstrating year-over-year increases in new pool permits of 2 percent and 12 percent respectively.

West Florida

The western region of Florida ranked #2 for swimming pool construction last year, having more than 4,920 pool starts on record and reflecting a 10 percent year-over-year increase in new pool construction.  More than half of all new permits originated from Hillsborough County (1,542 permits) and Pasco County (1,004 permits), reflecting year-over-year increases in new construction of 4 percent and 20 percent respectively.

Southeast Florida

Not far behind the western portion of Florida, the southeastern region ranked #3 for new pool construction, having more than 4,740 pool starts last year and demonstrating a nominal 1 percent decrease in new swimming pool construction activity.  The bulk of new construction took place in the counties of Palm Beach (1,650 permits) and Miami-Dade (1,234 permits), and while overall the southeast did not exhibit any notable gains, Indian River County experienced a 16 percent year-over-year increase in new pool construction.

Central Florida

Last year, Central Florida experienced a 3 percent year-over-year decrease in new swimming pool construction, resulting in 4,155 new permits on record.  The county with the greatest concentration of new construction activity was Orange County (1,454 permits) which was one of the few counties exhibiting growth in the form of a 10 percent year-over-year increase in new pool construction.

Northeast Florida

In the northeastern region of Florida, there were 2,578 pool starts on record last year, reflecting a 6 percent year-over-year increase in new pool construction.  Approximately 60 percent of all new construction took place in the counties of Duval (656 permits) and St. Johns (870 permits).

Northwest Florida

Last year, the northwestern region of Florida experienced a 13 percent year-over-year increase in new swimming pool construction, resulting in more than 2,560 new permits on record with HBW.  Santa Rosa County carried the highest concentration of swimming pool construction activity in the area, having more than 515 new permits on record and demonstrating a 17 percent year-over-year increase in new swimming pool construction.

To gain more information on the builders, homeowners and permits for the construction activity above, check out HBW for your copy of the latest construction data reports. To gain access to the HBW database and receive custom and detailed reports on the latest residential and commercial building activity in Florida, Georgia, Texas, Alabama, and Oklahoma, please contact HBW for details.
Florida Top Pool Builders – December 2019

A review of construction activity and leading builders on record with HBW for new swimming pool construction in Florida during the month of December 2019

In Florida, there were 1,630 swimming pool starts with a total construction value in excess of $74 million last month.  Out of the five major regions reviewed (Tampa, Southwest, Southeast, Orlando, Jacksonville), Southwest Florida held the highest concentration of new construction activity (total permits: 522), while Tampa held the greatest average value of construction (average value: $52,554).

When reviewing the leading contractors behind the figures, we found that most were regionally focused, with several builders taking the lead for total pool starts in each area during the one-month period.

Here is a closer look at new swimming pool construction by region and based on the total number of permits on record with HBW, along with the top five leading contractors in each area:

Southwest

The Southwest region of Florida carried approximately 32 percent of all new swimming pool construction in the Sunshine State last month, having 522 pool starts with a total construction value of nearly $24 million last month.  The average value of construction landed mid-range (average value: $45,689) in comparison to other regions reviewed, and out of the more than 130 active pool builders with permits on record last month, the following ranked as the top five for total new permits:

Builder Total Permits
Aragon Pools & Spas 53
Coast to Coast Pools 41
Pinnacle USA 23
Superior Pools of SW Florida 22
Waterscapes Pools & Spas 20


Tampa

In Tampa, there were more than 335 swimming pool starts with a total construction value in excess of $17.5 million last month.  The average value of construction was highest in Tampa (average value: $52,554) in comparison to other regions reviewed, and out of the approximately 105 active pool builders in the area last month, the following ranked as the top five for total new permits:

Builder Total Permits
Olympus Pools 25
Tampa Bay Pools Inc 18
T & D Pool & Spa Construction 16
Holiday Pools of West FL 14
Gulfstream Pools & Spas 12


Southeast

Last month, there were nearly 330 swimming pool starts with a total construction value of approximately $12.8 million in the southeastern region of Florida.  The average value of new pool construction was lowest in the Southeast (average value: $38,968) in comparison to other regions reviewed, and out of the 120 active pool builders on record last month, the following ranked as the top five for total new permits:

Builder Total Permits
Swimming Pool Contractors 28
A&G Concrete Pools 17
Fountain Blue Pool Service 14
Pool Builders Inc. 13
Louden Bonded Pools 13


Orlando

In Orlando, there were approximately 265 swimming pool starts with a total construction value of nearly $11 million last month.  The average value of new pool construction in the area landed on the lower end of the spectrum (average value: $41,083) in comparison to other regions reviewed, and out of the nearly 65 contractors with new construction activity on record for the month, the following ranked as the top five for total new permits:

Builder Total Permits
Bobs Pool Service 53
All Seasons 17
Atlas Pools of Central FL 13
American Pools & Spas 13
Legacy Pools 13


Jacksonville

Last month, there were just over 180 swimming pool starts with a total construction value in excess of $9 million in the Jacksonville area.  The average value of construction landed on the higher end of the spectrum (average value: $50,231) in comparison to other Florida regions reviewed, and out of the approximately 65 active contractors in the area last month, the following ranked as the top five for total new swimming pool construction permits:

Builder Total Permits
Blue Haven Pools 23
Crystal Pools & Spas 9
Pools by John Clarkson 7
Agua Pools & Spas 6
Backyard Designs 6


To gain more information on the builders, homeowners and permits for the construction activity above, check out HBW for your copy of the latest construction data reports. To gain access to the HBW database and receive custom and detailed reports on the latest residential and commercial building activity in Florida, Georgia, Texas, Alabama, and Oklahoma, please contact HBW for details.
Florida Residential Construction Review – December 2019

A review of the latest permit data on record with HBW for new home construction in Florida during the month of December 2019

Based on the latest permit data available from the HBW database, there were more than 5,100 housing starts with a total construction value of nearly $1.4 billion in Florida last month.  Out of the five major regions reviewed (Tampa, Southwest, Southeast, Orlando, Jacksonville), Tampa (1,476 permits) held the highest total number of new residential construction permits, while Southeast Florida carried the highest average value of new home construction (average value: $296,427).

Here is a closer look at total permits, leading counties and top builders by area in Florida last month:

Tampa

As previously mentioned, Tampa led Florida for new home construction last month, having 1,476 housing starts with a total construction value of nearly $435 million.  The average value of construction landed on the higher end of the spectrum in comparison to other regions reviewed (average value: $294,635), and the county with the highest concentration of new permits was Hillsborough County (427 permits).

Out of the 195 active home builders with new construction activity on record last month, the following ranked as the top five for total new permits:

Builder Total Permits
Lennar Homes 241
The Villages of Lake Sumter 162
D.R. Horton 155
Highland Homes 68
Pulte Homes 60


Southwest

Southwest Florida ranked #2 for new home construction last month as there were 1,273 housing starts with a total construction value in excess of $315 million.  The average value of new residential construction landed mid-range in comparison to other Florida regions reviewed (average value: $247,702), and more than half of all new construction took place in the counties of Lee (371 permits) and Sarasota (308 permits).

Out of the 235 active builders in the area last month, the following ranked as the top five for total new residential construction permits:

Builder Total Permits
D.R. Horton 211
Lennar Homes 155
Pulte Homes 136
Taylor Morrison 80
Neal Communities of SW FL 51


Orlando

In Orlando and surrounding areas, there were nearly 1,000 housing starts with a total construction value in excess of $292.6 million last month.  The average value of construction landed on the higher end of the spectrum coming in at $294,112, and the county with the highest concentration of housing starts was Orange County (328 permits).

Out of the more than 150 active builders in the area last month, the following ranked as the top five for total new permits on record with HBW:

Builder Total Permits
D.R. Horton 176
Lennar Homes 137
Meritage Homes 64
Starlight Homes Florida 40
Ryan Homes 39


Jacksonville

Last month, there were 713 housing starts with a total construction value of nearly $148 million in Jacksonville.  The average value of construction was lowest in Jacksonville (average value: $207,236) in comparison to other Florida regions reviewed, and the bulk of all new construction took place in the counties of Duval (314 permits) and St. Johns (199 permits).

Out of the nearly 100 active home builders with new construction activity on record for the month, the following ranked as the top five for total new permits:

Builder Total Permits
D.R. Horton 160
American Classic Homes 64
Lennar Homes 49
Dream Finders Home 47
Mattamy Homes 47


Southeast

In the Southeast, there were 646 housing starts with a total construction value of approximately $191.5 million during the month of December 2019. As previously mentioned, the average value of new home construction was highest in the southeastern region of Florida (average value: $296,427) in comparison to other areas reviewed, and the bulk of all new construction took place in Palm Beach County (214 permits) and St. Lucie County (203 permits).

Out of the 115 builders with construction activity on record for the month, the following ranked as the top five for total new permits:

Builder Total Permits
GL Building Corp. 116
Lennar Homes 110
D.R. Horton 50
Pulte Homes 30
Kolter Signature Homes 26


To gain more information on the builders, homeowners and permits for the construction activity above, check out HBW for your copy of the latest construction data reports. To gain access to the HBW database and receive custom and detailed reports on the latest residential and commercial building activity in Florida, Georgia, Texas, Alabama, and Oklahoma, please contact HBW for details.

Texas Swimming Pool Construction Review – 2019

An HBW report on construction permit data for new swimming pool construction in Texas from January through December 2019

For the last two years, new swimming pool construction has been on the rise in the Lone Star State.  Based on HBW’s latest Swimming Pool Construction Activity Trend Report for 2019, Texas experienced a 3 percent year-over-year increase in new pool construction, resulting in nearly 8,850 new permits on record for the one-year period.  Out of the four major metro areas reviewed (Dallas, Houston, Austin, San Antonio), Dallas (4,249 permits) held the highest concentration of new swimming pool permits last year, while the Houston area demonstrated the highest rate of growth in new pool construction (+14 percent).

Here is a closer look at the permit totals, leading counties and annual comparisons for new swimming pool construction in Texas last year:

Dallas

As previously mentioned, Dallas carried the greatest total amount of swimming pool starts last year in comparison to other regions reviewed, having nearly 4,250 pool starts on record with HBW.  That being stated, Dallas was the only metro area to exhibit a decline in the market as there was a 4 percent decrease in new pool construction in comparison to 2018.  Despite the overall and slight slowing in new swimming pool permit activity, pool construction was on the rise in a few counties including Denton County (+3.2 percent) and Rockwall (+14 percent).  The majority of new construction and bulk of permits originated from three counties: Tarrant (1,034 permits), Collin (1,008 permits), Dallas (947 permits).

Houston

Houston ranked #2 for new swimming pool construction last year as there were more than 2,790 pool starts on record with HBW.  Since 2018, new pool construction has been on the rise in Houston, and in 2019 the area experienced a 14 percent year-over-year increase in new pool permits.  More than half of all new construction activity took place in Harris County (1,718 permits) where there was a 21 percent year-over-year increase in new pool construction.

Austin

Last year, the Austin area experienced a 10 percent year-over-year increase in new swimming pool construction, resulting in more than 1,090 new permits on record with HBW for the one-year period.  Nearly all new construction took place in Travis County (841 permits) where there was more than a 12 percent year-over-year increase in new pool permitting activity.

San Antonio

In San Antonio, new pool construction has been increasing on an annual basis since 2015 with spikes ranging from 5 percent to 8 percent.  Last year, the San Antonio area experienced a 7 percent year-over-year increase in new swimming pool construction, resulting in approximately 715 new permits on record with HBW.  The majority of all new construction took place in Bexar County (553 permits) where there was an 8 percent year-over-year increase in new pool permits.

To gain more information on the builders, homeowners and permits for the construction activity above, check out HBW for your copy of the latest construction data reports. To gain access to the HBW database and receive custom and detailed reports on the latest residential and commercial building activity in Florida, Georgia, Texas, Alabama, and Oklahoma, please contact HBW for details.

Annual Report: Texas New Residential Construction 2019

An annual overview of construction permit data for Texas from January through December 2019

Based on HBW’s latest Building Activity Trend Report for new residential construction in Texas last year, new home construction was slow across the Lone Star State.  In 2019, there were approximately 74,860 housing starts in the combined metro areas of Dallas, Houston, San Antonio and Austin, reflecting a 4 percent year-over-year decrease in residential construction.  While new home construction was on the decline overall and statewide, not every metro area was slow in comparison to 2018.  For example, the market in Houston remained steady with the previous year, and the Austin area came out ahead with a 4 percent year-over-year increase in housing starts.

Houston – When reviewing permit data for higher concentrations of housing starts, the Houston area carried the greatest total number of new permits in comparison to other metro areas reviewed as there were 31,765 new residential construction permits on file for the one-year period.  While new home construction has been on the rise since 2017 in the Houston area, 2019 marked a stable market as figures are steady with the previous year.

Dallas – While the Dallas area ranked second for total housing starts (24,053 permits), last year was the first year that new home construction was on the decline in five years.  Overall, the Dallas area experienced a 13 percent year-over-year decrease in new home construction in 2019, with counties experiencing annual drops as great as 26 percent.  The only county that appears to be immune to the lows of the residential construction market is Ellis County.  Since 2015, new home construction has been on the rise in Ellis County year after year, and in 2019 there were more than 1,830 housing starts in Ellis, reflecting a 9.5 percent year-over-year increase in new home construction.

Austin – As previously mentioned, Austin is the one metro area out of the four reviewed that demonstrated an increase in new residential construction last year. In Austin, there were more than 11,955 housing starts in 2019, reflecting a year-over-year increase of 4 percent in new home construction.  More than half of all new construction took place in Travis County where there were 7,665 housing starts and a nearly 11 percent year-over-year increase in new residential construction permits.

San Antonio – Although new home construction has been on the rise in San Antonio since 2015, last year the area demonstrated a 3 percent decrease in new residential construction permits.  Out of the nearly 7,090 housing starts on file with HBW for San Antonio, more than half originated from Bexar County; while housing starts were on the decline overall in the San Antonio area last year, Bexar County appears to be holding strong as there were more than 4,660 new residential construction permits on record in 2019, reflecting a 15 percent year-over-year increase in new home construction.

To gain more information on the builders, homeowners and permits for the construction activity above, check out HBW for your copy of the latest construction data reports. To gain access to the HBW database and receive custom and detailed reports on the latest residential and commercial building activity in Florida, Georgia, Texas, Alabama, and Oklahoma, please contact HBW for details.

Annual Report: Atlanta Residential Construction 2019

A review of residential construction permit data for Metro Atlanta as recorded by HBW for 2019

Final figures for new home construction in the Atlanta area are now available in the HBW database.  According to the most recent HBW Building Activity Trend Report for new residential construction in Metro Atlanta, there were approximately 23,725 housing starts last year, reflecting a 3 percent year-over-year decrease in new home construction.

Since 2012, the Metro Atlanta area has demonstrated annual growth in its housing market, with the total number of housing starts on record increasing year after year.  In 2018, the high growth pattern began to slow, and based on permit totals recorded by HBW, the market began to even out and hold steady.  After reviewing the latest figures from 2019, it looks like the slowing has continued, resulting in Atlanta’s first year-over-year decrease in new home construction since 2011.

That being stated, there are a few counties where new residential construction spiked last year… For example, in Paulding County there were nearly 1,320 housing starts last year, reflecting a 5 percent year-over-year increase in new home construction.  Additionally, Clayton County climbed out of its two-year decline having a whopping 182 percent year-over-year increase in housing starts last year which resulted in approximately 875 new residential construction permits on record.  Another county that previously demonstrated a declining market since 2017 only to come out strong last year is Coweta County; in Coweta there were nearly 900 housing starts in 2019, reflecting a 29 percent year-over-year increase in new home construction.

When reviewing construction permit data to identify counties carrying the highest concentration of housing starts, the three counties that topped the list include Gwinnett, Fulton and Cherokee.

Although Gwinnett County (3,175 permits) experienced an 8 percent year-over-year decrease in new home construction, it led the Metro Atlanta area by having the highest total number of new permits on record with HBW for the one-year period.

While Fulton County ranked second for total housing starts (2,300+ permits), it was #1 for higher value residential construction (value greater than $500k) as approximately 15 percent (328 permits) of all new permits held values greater than $500k.

Finally, Cherokee County appears to be gaining upward momentum from the minor decrease experienced in 2018 as it demonstrated a 2 percent year-over-year increase in new home construction last year, resulting in 2,163 housing starts on record for 2019.

Information utilized for the above listed figures for Metro Atlanta residential construction was directly derived from HBW construction data reports. To gain access to the HBW database and receive custom and detailed reports on the latest residential and commercial building activity in Florida, Georgia, Texas, Alabama, and Oklahoma, please contact HBW for details.

Texas Swimming Pool Construction Report – December 2019

A review of construction permit data for new swimming pool construction in Texas during the month of December 2019

Last month, there were approximately 630 new swimming pool construction permits in Texas with a total value in excess of $31.3 million added to the HBW database.  Out of the four major metro areas reviewed (Dallas, Houston, Austin, San Antonio), Dallas (302 permits) carried the highest concentration of new permits, and Austin held the highest average value (average value: $65,938) of new swimming pool construction.

Here is a closer look at the total permits, average value of construction and leading counties for new swimming pool construction in Texas during the month of December 2019:

Dallas

Last month, nearly half of all new swimming pool construction in Texas took place in the Dallas metro area as there were just over 300 new permits with a total value of approximately $12.9 million.  The average value of new pool construction in Dallas landed mid-range (average value: $42,675) in comparison to other metro areas reviewed, and the county with the highest concentration of new construction activity was Collin County (91 permits).

Houston

Houston ranked second for new pool construction activity during the month of December.  During the one-month period, there were approximately 195 pool starts with a total construction value of nearly $11.8 million.  The average value of new construction landed on the higher end of the spectrum (average value: $60,704) in comparison to other metro areas reviewed, and nearly half of all new construction activity took place in Harris County (98 permits).

Austin

Last month, there were approximately 80 pool starts with a total construction value of more than $5.2 million in Austin.  The average value of new swimming pool construction was highest in Austin (average value: $65,938) in comparison to other metro areas reviewed, and the bulk of all new permits originated from Travis County (59 permits).

San Antonio

In San Antonio, there were 53 new swimming pool permits with a total construction value in excess of $1.4 million added to the HBW database last month.  The average value of new construction was lowest in San Antonio (average value: $27,068) in comparison to other metro areas reviewed, and the majority of all construction activity took place in Bexar County (36 permits).

To gain more information on the builders, homeowners and permits for the construction activity above, check out HBW for your copy of the latest construction data reports. To gain access to the HBW database and receive custom and detailed reports on the latest residential and commercial building activity in Florida, Georgia, Texas, Alabama, and Oklahoma, please contact HBW for details.