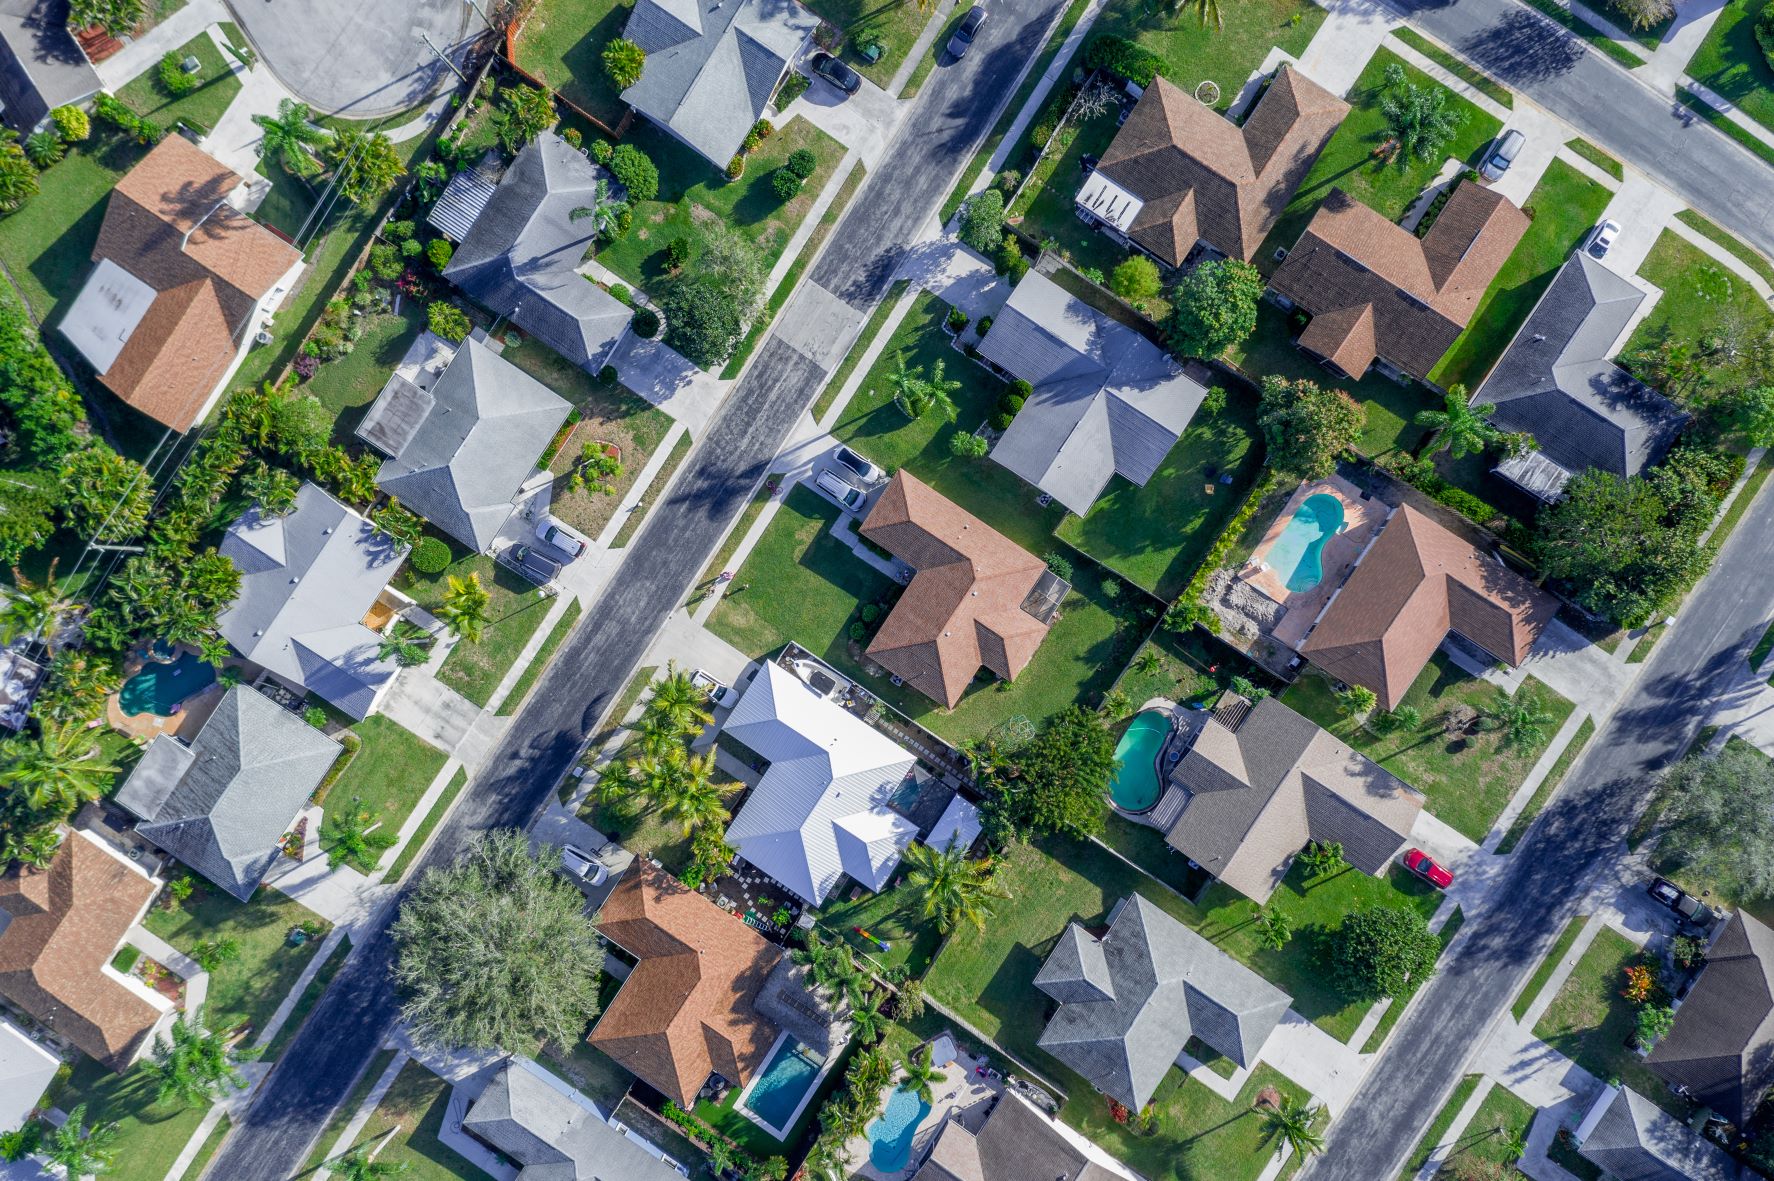
Florida Residential Construction Review – December 2020

A review of permit data for new residential construction in Florida during the month of December 2020

Based on the latest construction data reports from HBW, there were approximately 6,860 housing starts with a total construction value of nearly $1.9 billion in Florida last month.  Out of the five major regions reviewed (Tampa, Southwest, Orlando, Southeast, Jacksonville), the greatest volume of new home construction took place in Tampa (1,816 permits), and the highest average value of construction could be found in the southeastern region of the state (average value: $317,426).

Here is a closer look at the total permits, average value of construction and leading counties and contractors throughout the Sunshine State during the month of December 2020:

Tampa

As previously noted, Tampa held the greatest amount of new residential construction activity last month having 1,816 housing starts with a total construction value in excess of $507 million.  The average value of new home construction in the Tampa area (average value: $279,357) landed mid-range in relation to other Florida regions reviewed, and approximately 60 percent of all new permits originated from the counties of Polk (548 permits) and Pasco (529 permits).

Out of the more than 220 contractors with new residential construction activity on record for the Tampa area last month, the following ranked as the top three for total new permits:

Builder Total Permits
1-Lennar Homes 301
2-D.R. Horton 193
3-The Villages of Lake Sumter 151

Southwest

In the southwestern region of Florida, there were 1,766 housing starts with a total construction value of $441.5 million.  The average value of new home construction was $250,025, and more than half of all new permits originated from the counties of Lee (527 permits) and Sarasota (440 permits).

Out of the nearly 270 contractors with new residential construction permits on record in the southwest last month, the following ranked as the top three for total new permits:

Builder Total Permits
1-D.R. Horton 269
2-Lennar Homes 193
3-Pulte Homes 177

Orlando

Last month, there were nearly 1,270 housing starts with a total construction value of approximately $398 million in the Orlando area.  The average value of new home construction landed on the higher end of the spectrum (average value: $313,614) in comparison to other Florida regions reviewed, and the county with the highest concentration of new residential construction activity was Orange County with more than 370 new permits for the one-month period.

Out of the approximately 155 contractors with new construction activity on record for the Orlando area last month, the following ranked as the top three for total new permits:

Builder Total Permits
1-D.R. Horton 194
2-Lennar Homes 103
3-Mattamy Homes 78

Jacksonville

Just behind Orlando, Jacksonville had 1,243 housing starts with a total construction value of $289 million on record with HBW last month.  The average value of new home construction was lowest in Jacksonville (average value: $232,541) in comparison to other Florida regions reviewed, and the majority of all new residential construction took place in the counties of St. Johns (444 permits) and Duval (415 permits).

During the month of December, there were more than 120 contractors with new home construction activity on record in the Jacksonville area, and the following ranked as the top three for total new permits:

Builder Total Permits
1-D.R. Horton 226
2-Lennar Homes 192
3-Dream Finders Construction 85

Southeast

Last month, there were 765 housing starts with a total construction value of $242.8 million in the southeastern region of Florida.  The average value of new home construction was highest in the southeast (average value: $317,426) in comparison to other regions reviewed, and the county with the greatest concentration of new residential construction activity was St. Lucie with 363 new permits for the one-month period.

Out of the 135 active contractors with new permits on record with HBW in the southeast last month, the following ranked as the top three for total new permits:

Builder Total Permits
1-GL Building Corp 124
2-D.R. Horton 94
3-Holiday Builders 67


To gain more information on the builders, homeowners and permits for the construction activity above, check out HBW for your copy of the latest construction data reports. To gain access to the HBW database and receive custom and detailed reports on the latest residential and commercial building activity in Florida, Georgia, Texas, Alabama, and Oklahoma, please contact HBW for details.

Texas Swimming Pool Construction Review – December 2020

A review of the new swimming pool construction permit data on record with HBW for the month of December 2020

Based on the latest construction data reports from HBW, there were more than 850 new swimming pool permits with a total construction value of approximately $40.5 million added to the HBW database for Texas last month.  Out of the four major metro areas reviewed (Dallas, Houston, Austin, San Antonio), Dallas carried the highest volume of pool starts (428 permits), while Austin carried the highest average value of new pool construction (average value: $64,264).

Here is a closer look and breakdown of the permit data and leading pool contractors by Texas metro area for the month of December 2020:

Dallas

As previously mentioned, Dallas carried the greatest amount of pool construction starts in comparison to other Texas areas reviewed, having nearly 430 new permits with a total construction value of $17 million on record last month.  The average value of new swimming pool construction landed on the lower end of the spectrum in Dallas (average value: $39,591), and more than half of all new permits originated from the two counties of Collin (133 permits) and Denton (115 permits).

Out of more than 155 contractors with new swimming pool construction on record in the Dallas area last month, the following ranked as the top three for total new permits for the one-month period:

Builder
1-Riverbend Pools
2-Puryear Custom Pools
3-Foley Custom Pools

Houston

Last month, Houston ranked #2 for new swimming pool construction, having approximately 270 new permits with a total construction value of $15.2 million on record for the one-month period.  The average value of new pool construction landed on the higher end of the spectrum (average value: $56,509) in comparison to other Texas regions reviewed, and nearly all new swimming pool construction activity took place in the counties of Harris (110 permits) and Montgomery (83 permits).

Out of the more than 130 active pool contractors in the Houston area with new construction activity on record last month, the following ranked as the top three for total new permits:

Builder
1-Premier Pools
2-Supreme Pools & Spas
3-Backyard Oasis

Austin

In Austin, there were nearly 105 pool starts with a total construction value of approximately $6.7 million last month.  The average value of new swimming pool construction was highest in the Austin area (average value: $64,264) in comparison to other Texas metro areas reviewed, and more than half of all new permits originated from Travis County (69 permits).

Out of the nearly 55 pool builders with new construction activity on record in the Austin area last month, the following ranked as the top three for total new permits:

Builder
1-Cody Pools
2-Premier Pools & Spas of Austin
3-Anthony & Sylvan Pools

San Antonio

Last month, there were more than 50 pool starts with a total construction value of $1.7 million in the San Antonio area.  The average value of new swimming pool construction was lowest in San Antonio (average value: $31,919) in comparison to other Texas metro areas reviewed, and the county with the greatest concentration of new construction activity was Bexar County with 23 permits for the one-month period.

Out of the 25 active contractors with new swimming pool construction permits on record last month, the following ranked as the top three for total new permits:

Builder
1-Keith Zars Pools
2-Blue Haven Pools
3-Texas Pools & Patios

To gain more information on the builders, homeowners and permits for the construction activity above, check out HBW for your copy of the latest construction data reports. To gain access to the HBW database and receive custom and detailed reports on the latest residential and commercial building activity in Florida, Georgia, Texas, Alabama, and Oklahoma, please contact HBW for details.

Atlanta New Home Construction Annual Review – 2020

A review of new residential construction permit data on record for Atlanta during 2020

As we say goodbye to 2020 and hello to 2021, HBW is in the process of reviewing construction permit data over the last year to identify building trends and areas where there have been gains (and losses) in the market.  HBW construction data reports provide an in-depth and detailed overview of everything from leading contractors to the number of permits and construction values for any given area, and today we are looking at new residential construction activity in the Metro Atlanta area.

Last year, there were more than 23,320 housing starts in the Metro Atlanta area, reflecting a 5 percent year-over-year decrease in new residential construction.  Out of the twenty-four counties that make up the metro area of Atlanta, five counties carried approximately 50 percent of all new construction activity, and those counties were as follows:

Gwinnett County

Gwinnett County ranked #1 for new home construction last year, having nearly 3,720 housing starts on record and demonstrating a 17 percent year-over-year increase in new home construction.  This marked increase in new residential construction activity is the first annual increase the area has experienced in housing starts since 2017.

Cherokee County

Last year, there were approximately 2,345 housing starts in Cherokee County, reflecting an 8 percent year-over-year increase in new residential construction.  Over the last five years, the area has demonstrated incremental increases in housing starts (with the exception of 2018), and with last year’s increase in new residential construction activity, the area appears to be on track with the average annual rise exhibited in recent years.

Forsyth County

In Forsyth County, there were 2,040 housing starts in 2020, reflecting a 10 percent year-over-year increase in new home construction.  Since 2015, new residential construction has been on the decline in Forsyth County, with annual decreases ranging from as low as 1 percent (2016) to as high as 23 percent (2019).  Last year, the area broke the downward trend with a significant increase in new residential construction, making it a county to watch in the coming years.

Cobb County

With an 8 percent year-over-year increase in new residential construction permits, Cobb County had more than 1,815 housing starts on record in 2020.  Since 2015, Cobb County had exhibited significant annual increases in new home construction up until 2019 when there was a major dip in the market (-23%).  With the 8 percent increase in new residential construction last year, the market appears to be recovering from the drop in 2019 and potentially back on an upward trend.

Fulton County

Out of the five counties identified with the greatest volume of new home construction activity in the Metro Atlanta area last year, Fulton County was the only one on record with a significant decrease in new residential construction permits.  Last year, there were 1,700 housing starts in Fulton County, reflecting a 26 percent year-over-year decrease in new home construction, making it the second consecutive year that the area has exhibited a decline in the market.


Information utilized for the above listed figures for Metro Atlanta residential construction was directly derived from HBW construction data reports. To gain access to the HBW database and receive custom and detailed reports on the latest residential and commercial building activity in Florida, Georgia, Texas, Alabama, and Oklahoma, please contact HBW for details.

Texas Top Home Builders – December 2020

A look at the top five residential construction contractors in each major metropolitan area of Texas during the month of December 2020

Earlier this week, we reviewed the latest permit data available from HBW for new residential construction in Texas and found that there were nearly 6,900 housing starts with a total construction value in excess of $1.6 billion on record for the month of December. Today, we are taking a look at the same construction data reports to identify the leading contractors who carried the highest volume of housing starts last month.  And while each metropolitan area of Texas has its own unique lineup of leading home builders, there have been and continue to be two major players in the market month after month – From across the four major metro areas reviewed (Houston, Dallas, Austin, San Antonio), both D.R. Horton and Lennar Homes continue to carry the highest concentration of new residential construction activity, having approximately 745 and 520 permits on record respectively.

Here is a closer look at the top five builders for each major metro area in Texas based on the total number of permits on record with HBW during the month of December 2020:

Houston

Builder Total Permits  Average Value
1. D.R. Horton 284  $      148,025.00
2. Perry Homes 166  $      237,410.00
3. Lennar Homes 164  $      152,708.00
4. K Hovnanian Homes 164  $      148,162.00
5. Camillo Properties 137  $      118,999.00

Dallas

Builder Total Permits  Average Value
1. D.R. Horton 302  $      204,056.00
2. Bloomfield Homes 179  $      324,871.00
3. Lennar Homes 168  $      254,031.00
4. Meritage Homes 162  $      254,619.00
5. First Texas Homes 110  $      334,948.00

Austin

Builder Total Permits  Average Value
1. D.R. Horton 152  $  190,691.00
2. Lennar Homes 131  $  156,814.00
3. KB Homes 55  $  195,133.00
4. The Brohn Group 52  $  163,535.00
5. Pulte Homes 36  $  374,768.00

San Antonio

Builder Total Permits  Average Value
1.Lennar Homes 56  $  244,549.00
2. Continental Homes of Texas 37  $  223,161.00
3. KB Homes 30  $  234,183.00
4. Trendmaker Homes 23  $  454,380.00
5. Chesmar Homes 22  $  250,000.00


To gain more information on the builders, homeowners and permits for the construction activity above, check out HBW for your copy of the latest construction data reports. To gain access to the HBW database and receive custom and detailed reports on the latest residential and commercial building activity in Florida, Georgia, Texas, Alabama, and Oklahoma, please contact HBW for details.

HBW Report: Texas Residential Construction – December 2020

A review of residential construction permit data for Texas during the month of December 2020

Based on the latest HBW construction data reports, last month there were nearly 6,900 housing starts with a total construction value in excess of $1.6 billion in the Lone Star State.  Upon reviewing reports for the four major metropolitan areas in Texas (Houston, Dallas, Austin, San Antonio), we found that the greatest concentration of housing starts originated from Dallas (2,723 permits) last month, and Dallas continued to carry a higher average value of new residential construction (average value: $278,327) in comparison to the other areas reviewed.

Here is a closer look at the total permits, average value of housing starts and leading counties for new home construction in Texas during the month of December 2020:

Dallas

As previously mentioned, the greatest volume of new construction activity, as well as the highest average value, took place in the Dallas area last month where there were 2,723 housing starts with a total construction value of nearly $758 million.  The average value of new home construction was $278,327, and more than half of all new permits originated from the counties of Collin (772 permits) and Tarrant (739 permits).

Houston

While Houston is usually leading Texas for residential construction, last month it ranked #2 with 2,673 housing starts and a total construction value of nearly $531.5 million.  The average value of construction has been and continues to remain lowest in Houston (average value: $198,809) in comparison to other Texas regions reviewed, and the county with the highest concentration of new residential construction activity was Harris County (1,174 permits).

Austin

Last month, there were more than 980 housing starts with a total construction value of nearly $225.5 million in the Austin area.  The average value of new home construction was $228,810, and approximately 63 percent of all new permits originated from Travis County where there were 618 housing starts on record for the one-month period.

San Antonio

In the San Antonio area, there were approximately 515 housing starts with a total construction value of $129.5 million last month.  The average value of new home construction was $251,861, and the bulk of all new permits originated from Bexar County (334 permits).

To gain more information on the builders, homeowners and permits for the construction activity above, check out HBW for your copy of the latest construction data reports. To gain access to the HBW database and receive custom and detailed reports on the latest residential and commercial building activity in Florida, Georgia, Texas, Alabama, and Oklahoma, please contact HBW for details.

Quick Tips for Digital Marketing Success in 2021

Tips for improving your digital marketing efforts in 2021

Happy New Year! Everyone has been looking forward to a new year, and a change from 2020.  This sentiment runs from our personal lives to the many businesses that are looking for a boost from the challenges faced in the last year. 

In order to be successful in 2021, we must take a look back at the lessons learned and trends that have developed over the last year to improve our position for the next one, and with the pandemic, online activity for both work and play has surged to unprecedented levels.  In fact, online sales reached $39 billion in the U.S. in 2020, reflecting a year-over-year increase of 36 percent (source: DigitalCommerce360.com).  For this reason, we are reviewing some quick tips to amp up your digital marketing efforts:

  1. Get in with Google – Everyone (and I mean everyone) uses Google to find out about nearly everything, but did you know that it can be a powerful (and affordable) way to promote your business?  On average, there are approximately 3.5 billion Google searches per day (source: Internet Live Stats), making it one of the best ways to be in front of consumers who are seeking your services and related products.  To build your presence through Google, you will need to start with creating and verifying your Google Business profile; this profile will enable your company to be visible in Google Map results, as well as local searches.  Even better- it is free of charge and easy to set up.
  2. Maximize Your Website – This goes without saying, but every business needs a website, no matter how small or how much of your business is word-of-mouth.  In 2021, much of word-of-mouth marketing is online, and your website is the first go-to for any prospective customer; after all, once they know your name, they will most likely “Google” you to learn more about your services (and reputation).  For this reason, make sure your website is current, optimized for mobile viewing and that you have an SEO strategy in place.
  3. Start a Blog – Creating blog content is a vital part of SEO, as well as a great way to show what your business is doing now and highlight your expertise.  A blog is a valuable tool in promoting your business and gives you ample creative room to develop and share the voice of your brand.  From educational content to posts covering keywords and topics that your customers are searching, your blog can boost your image and ranking with search engines.
  4. Share Content – Don’t just publish great posts and blog stories – share them!  From business partners and employees to your own personal networks, share, share and share again.  Your blog stories, videos, photos and really all posts can be shared within other social platforms, in email newsletters, and downloadable resources to add to your growing list of leads.
  5. Mail it Out – There are two forms of mail that we are looking at here – direct mail and email.  And while we are focusing on digital marketing efforts in this post, we don’t want to diminish the power of direct mail; despite the dominant role that digital media plays in our world today, postcards, flyers and letters can still be effective ways to promote your business on the local level.  Additionally, with the help of QR codes and short links, direct mail can drive prospects to your digital content.  When it comes to contacting the many new HBW leads that are being generated for subscribers each month, both email and direct mail can be effective methods for making initial contact and diversifying your touchpoints.

While the above list isn’t exhaustive by any means, it provides a starting point to get you thinking about new ideas, reviewing current efforts and making additions and improvements to your marketing strategy.  By starting the year off with a fresh approach and strong content, you can position your business to effectively reach your target audience and make 2021 an unforgettable year for all the right reasons.

For more information on construction business marketing tips, stay connected with the HBW Blog.  To get ahead of construction activity and gain access to the latest permitting data in Florida, Texas, Georgia, Alabama and Oklahoma, contact HBW for more information on construction data reports and industry leads.

Florida Top Pool Builders – November 2020

A review of the leading pool contractors in Florida during the month of November 2020I

As reported last week, there were more than 2,900 new swimming pool construction permits with a total value of approximately $144 million added to the HBW database for Florida during the month of November.  Today, we are digging into the reports further to identify the leading contractors driving new pool construction figures in each of the five major regions of Florida last month.

Based on the latest HBW construction data reports, the pool builders with the greatest number of new swimming pool construction permits on record in Florida for the month of November are as follows:

Tampa

Out of the approximately 125 active contractors with new swimming pool construction on record with HBW in the Tampa area last month, the following ranked as the top five for total new permits:

Builder Total Permits  Average Value
1-Olympus Pools 52  $    63,458.00
2-Challenger Pools 40  $    59,961.00
3-Gulfstream Pools & Spas 27  $    55,772.00
4-T&D Pool & Spa Construction 25  $    66,227.00
5-Riviera Pools of Tampa 22  $    56,585.00

Southwest

Last month, there were 165 contractors with new swimming pool construction on record with HBW in the southwestern region of Florida, and the following ranked as the top five for total new permits for the one-month period:

Builder Total Permits  Average Value
1-Coast to Coast Pools 78  $        39,961.00
2-Pinnacle USA 68  $        38,206.00
3-Aragon Pools & Spas 53  $        33,774.00
4-Custom Pools by Design 29  $        53,221.00
5-Holiday Pools of West FL 27  $        41,875.00

Southeast

In the southeastern region of Florida, there were nearly 210 pool contractors with new construction activity on record with HBW last month, and the following ranked as the top five for total new permits:

Builder Total Permits  Average Value
1-A&G Concrete Pools 33  $    60,526.00
2-Swimming Pool Contractors 31  $    22,478.00
3-Fountain Blue Pool Service 20  $    47,929.00
4-Champion Pools & Spas 19  $    57,884.00
5-Craft Master Custom Pools 19  $    50,145.00

Orlando

Last month, there were more than 115 contractors with new swimming pool construction on record in the Orlando area, and the following ranked as the top five for total new permits:

Builder Total Permits  Average Value
1-American Pools & Spas 40  $    60,398.00
2-Dreamscapes Pools & Spas 39  $    45,385.00
3-Artesian Pools 26  $    44,708.00
4-Holland Pools 26  $    26,330.00
5-Atlas Pools of Central Florida 18  $    86,543.00

Jacksonville

In Jacksonville, there were 85 contractors with new pool construction on record with HBW last month, and the following ranked as the top five for total new permits for the one-month period:

Builder Total Permits  Average Value
1-Pools by John Clarkson 19  $    61,776.00
2-Tier 1 Pools and Spas 12  $    71,116.00
3-Crown Pools 12  $    68,099.00
4-Blue Haven Pools 12  $    59,457.00
5-Island Pools 11  $    58,874.00


To gain more information on the builders, homeowners and permits for the construction activity above, check out HBW for your copy of the latest construction data reports. To gain access to the HBW database and receive custom and detailed reports on the latest residential and commercial building activity in Florida, Georgia, Texas, Alabama, and Oklahoma, please contact HBW for details.

HBW Report: Florida Swimming Pool Construction – November 2020

A review of construction data for new swimming pool construction in Florida during the month of November 2020

According to the latest construction data reports from HBW, there were more than 2,900 new swimming pool construction permits with a total value of approximately $144 million added to the HBW database for the month of November 2020.  The report factored in all new swimming pool construction permits from five major regions of the Sunshine State: Southwest, Tampa, Orlando, Southeast, Jacksonville.  Out of the regions reviewed, the southwest carried the greatest volume of new swimming pool construction (874 permits), while the Tampa area had the highest average value of new pool construction (average value: $57,517).

Here is a closer look at the total new permits, construction values and counties with the greatest concentration of new swimming pool construction for the month of November 2020:

Southwest

In the southwest, there were 874 pool starts with a total construction value of $40.2 million last month.  The average value of new swimming pool construction was $46,045, and the county with the greatest concentration of new pool construction permits was Lee County with 334 permits for the one-month period.

Southeast

Ranked #2 for new pool construction in Florida, the southeastern region had more than 640 pool starts with a total construction value of approximately $29.4 million during the month of November.  The average value of new pool construction was lowest in the southeast (average value: $45,862) in comparison to other Florida regions reviewed, and the county with the highest concentration of pool starts for the one-month period was Palm Beach (277 permits).

Tampa

In Tampa, there were approximately 580 pool starts with a total construction value in excess of $33.3 million last month.  The average value of new pool construction was highest in the Tampa area (average value: $57,517) in comparison to other Florida regions reviewed, and more than half of all new permits originated from the counties of Hillsborough (239 permits) and Pasco (149 permits).

Orlando

Last month, there were approximately 525 pool starts with a total construction value of nearly $25.3 million in the Orlando area.  The average value of new pool construction was $48,200, and the county with the highest concentration of new swimming pool construction activity was Orange County with nearly 210 new permits for the one-month period.

Jacksonville

In Jacksonville, there were more than 285 pool starts with a total construction value of approximately $15.9 million last month.  The average value of new pool construction landed on the higher end of the spectrum in Jacksonville (average value: $55,401) in comparison to other Florida regions, and the bulk of all new permits originated from the two counties of St. Johns (110 permits) and Duval (102 permits).


To gain more information on the builders, homeowners and permits for the construction activity above, check out HBW for your copy of the latest construction data reports. To gain access to the HBW database and receive custom and detailed reports on the latest residential and commercial building activity in Florida, Georgia, Texas, Alabama, and Oklahoma, please contact HBW for details.

Florida Top Home Builders – November 2020

A review of leading residential construction contractors in Florida based on new permits on record for the month of November

In our most recent post, “HBW Report: Florida Residential Construction Review – November 2020”, we reviewed the latest data pulled from new residential construction permits on record with HBW for the month of November; as previously reported, there were nearly 7,900 housing starts with a total construction value in excess of $2.1 billion in Florida last month.  This week, we are taking a closer look at the HBW construction data reports to identify leading home builders based on total housing starts on record for the month of November.

From the five major regions reviewed (Tampa, Southwest, Orlando, Southeast, Jacksonville), two companies continue to lead new residential construction activity throughout the state – D.R. Horton and Lennar Homes.  With more than 1,325 housing starts on record last month, D.R. Horton ranked #1 in four out of five regions, while Lennar Homes ranked #2 (statewide) with approximately 850 housing starts for the one-month period.

Here is a closer look at the leading home builders by Florida region during the month of November 2020:

Tampa

In the Tampa area, there were approximately 230 builders with new residential construction permits on record with HBW last month, and the following ranked as the top five for total new permits:

Builder Total Permits
1-D.R. Horton 339
2-Lennar Homes 246
3-The Villages of Lake Sumter 152
4-Pulte Homes 134
5-Highland Homes 85

Southwest

In the southwestern region of Florida, there were 280 active contractors with new home construction activity on record last month, and the following ranked as the top five for total new permits:

Builder Total Permits
1-D.R. Horton 346
2-Lennar Homes 221
3-Pulte/Centex Homes 103
4-Taylor Morrison 92
5-Neal Communities of SW FL 88

Southeast

Last month, there were approximately 150 contractors with new residential construction activity on record with HBW in the southeastern region of Florida, and the following ranked as the top five for total new permits for the one-month period:

Builder Total Permits
1-GL Building Corp 95
2-Lennar Homes 77
3-Pulte Homes 59
4-Kolter Signature Homes 57
5-D.R. Horton 52

Orlando

In Orlando, there were nearly 200 contractors with new residential construction activity on record last month, and the following ranked as the top five for total new permits:

Builder Total Permits
1-D.R. Horton 339
2-Taylor Morrison 87
3-Meritage Homes 79
4-CalAtlantic Homes 77
5-Lennar Homes 73

Jacksonville

Out of the 115 contractors with new residential construction permits on record with HBW in Jacksonville last month, the following ranked as the top five for total new permits:

Builder Total Permits
1-D.R. Horton 251
2-Lennar Homes 232
3-Dream Finders Construction 111
4-KB Homes 77
5-Mattamy Homes 62


To gain more information on the builders, homeowners and permits for the construction activity above, check out HBW for your copy of the latest construction data reports. To gain access to the HBW database and receive custom and detailed reports on the latest residential and commercial building activity in Florida, Georgia, Texas, Alabama, and Oklahoma, please contact HBW for details.

HBW Report: Florida Residential Construction Review – November 2020

A report on the latest permit data for new residential construction in Florida during the month of November 2020

Last month, there were nearly 7,900 housing starts with a total construction value in excess of $2.1 billion in the Sunshine State, reflecting an 8 percent month-over-month increase in new home construction.  Based on the latest HBW construction data reports for the five major regions of Florida (Tampa, Southwest, Orlando, Jacksonville, Southeast), the greatest volume of housing starts could be found in Tampa (2,122 permits), while the highest average value of new home construction could be found in the southeastern region (average value: $302,225).

Here is a closer look at the total number of permits, average value of construction and leading counties for new home construction in Florida last month:

Tampa

In Tampa, there were 2,122 housing starts with a total construction value of nearly $559 million last month.  The average value of new home construction in the Tampa area landed mid-range (average value: $263,287) in relation to other regions reviewed, and approximately 65 percent of all new permits originated from the two counties of Polk (792 permits) and Pasco (574 permits).

Southwest

Last month, there were approximately 1,840 housing starts with a total construction value in excess of $507.2 million in the southwestern region of Florida.  The average value of new home construction was $275,969, and more than half of all new permits originated from the counties of Lee (675 permits) and Manatee (352 permits).

Orlando

In Central Florida (Orlando), there were 1,686 housing starts with a total construction value in excess of $500 million last month.  The average value of new home construction landed on the higher end of the spectrum in the Orlando area (average value: $296,647) in comparison to other Florida regions reviewed, and just about half of all new construction activity took place in the counties of Orange (414 permits) and Lake (404 permits).

Jacksonville

In the Jacksonville area there were more than 1,325 housing starts with a total construction value of nearly $300 million on record with HBW for the month of November.  The average value of new home construction was lowest in Jacksonville (average value: $225,552) in comparison to other Florida regions reviewed, and the majority of all new permits originated from the counties of St. Johns (513 permits) and Duval (396 permits).

Southeast

Last month, there were 916 housing starts with a total construction value of nearly $277 million in the southeastern region of Florida.  As previously noted, the average value of new home construction was highest in the southeast (average value: $302,225) in comparison to other regions reviewed, and just about 71 percent of all new construction activity took place in the counties of St. Lucie (373 permits) and Palm Beach (280 permits).

To gain more information on the builders, homeowners and permits for the construction activity above, check out HBW for your copy of the latest construction data reports. To gain access to the HBW database and receive custom and detailed reports on the latest residential and commercial building activity in Florida, Georgia, Texas, Alabama, and Oklahoma, please contact HBW for details.