Florida Top Home Builders – January 2021

A review of leading home builders in Florida based on new permit data on record with HBW for the month of January 2021

Last week, we reviewed HBW’s latest construction data reports available for new home construction in Florida during the month of January.  This week, we are taking a closer look at the leading home builders who are driving the markets in the five major regions of the state (Southwest, Tampa, Orlando, Southeast, Jacksonville).

Statewide, there are two major players leading new home construction – D.R. Horton and Lennar Homes.  While each region has a varied list of contractors that make up the top five, both D.R. Horton and Lennar Homes have been consistently strong throughout the Sunshine State having 1,163 and 782 housing starts respectively for the one-month period.  Out of the five regions reviewed, both home builders landed on the top five list in nearly every area.

Here is a closer look at the leading home builders based on total new residential construction permits on record with HBW in Florida during the month of January 2021:

Southwest

In January, there were approximately 315 home builders with housing starts on record in Southwest Florida, and the following ranked as the top five for total new permits:

Builder Total Permits  Average Value
1-Lennar Homes 243  $      170,445.00
2-D.R. Horton 229  $      206,030.00
3-Pulte Homes 180  $      233,676.00
4-Taylor Morrison 112  $      225,886.00
5-Neal Communities of SW FL 91  $      219,619.00

Tampa

Out of the nearly 230 home builders with new residential construction activity on record in Tampa during the month of January, the following ranked as the top five for total new permits:

Builder Total Permits  Average Value
1-D.R. Horton 405  $      231,849.00
2-Lennar Homes 150  $      292,399.00
3-The Villages of Lake Sumter 129  $      310,045.00
4-Pulte Homes 111  $      262,701.00
5-Highland Homes 90  $      220,493.00

Orlando

In Orlando, there were approximately 185 home builders with new construction activity on record for January, and the following ranked as the top five for total new permits for the one-month period:

Builder Total Permits  Average Value
1-D.R. Horton 214  $      281,017.00
2-Minto Builders 98  $      298,831.00
3-Taylor Morrison 77  $      297,842.00
4-HCC Tamaya Residential 61  $      358,603.00
5-Pulte Homes 61  $      253,058.00

Jacksonville

In January, there were approximately 135 home builders with new construction activity on record with HBW in the Jacksonville area, and the following ranked as the top five for total new permits:

Builder Total Permits  Average Value
1-Lennar Homes 282  $      221,694.00
2-D.R. Horton 207  $      174,077.00
3-Dream Finders Construction 133  $      233,031.00
4-KB Homes 105  $      136,725.00
5-Toll Brothers 58  $      319,678.00

Southeast

Out of the nearly 160 contractors with new residential construction activity on record for Southeast Florida during the month of January, the following ranked as the top five for total new permits:

Builder Total Permits  Average Value
1-GL Building Corp 146  $        472,904.00
2-D.R. Horton 108  $        346,697.00
3-Kolter Signature Homes 76  $        321,400.00
4-Holiday Builders 55  $        228,003.00
5-Lennar Homes 52  $        177,858.00

To gain more information on the builders, homeowners and permits for the construction activity above, check out HBW for your copy of the latest construction data reports. To gain access to the HBW database and receive custom and detailed reports on the latest residential and commercial building activity in Florida, Georgia, Texas, Alabama, and Oklahoma, please contact HBW for details.

Florida: New Residential Construction Report – January 2021

A review of new residential construction permits added to the HBW database for Florida during the month of January 2021

When it comes to new home construction, Florida is off to a solid start this year.  In January, the Sunshine State experienced a 25 percent month-over-month increase in new residential construction, resulting in 8,565 housing starts with a total construction value in excess of $2.3 billion.  Out of the five Florida regions reviewed (Tampa, Southwest, Orlando, Jacksonville, Southeast), the Tampa area held the highest concentration of new home construction activity (2,244 permits), while Orlando carried the highest average value of housing starts (average value: $308,008).

Here is a closer look at the total permits, construction values and leading counties for new home construction throughout Florida during the month of January 2021:

Tampa

As previously mentioned, Tampa ranked #1 for new home construction last month, having 2,244 housing starts with a total construction value in excess of $611 million.  The average value of construction in Tampa (average value: $272,366) landed mid-range in comparison to other Florida regions reviewed, and more than half of all new permits originated from the counties of Polk (801 permits) and Pasco (621 permits).

Southwest

Not far behind Tampa, the southwestern region of Florida ranked #2 for new residential construction activity as there were approximately 2,220 housing starts with a total construction value in excess of $563.5 million last month.  The average value of new construction was $253,976, and just about half of all new permits originated from Lee County (658 permits) and Manatee County (461 permits).

Orlando

In Orlando, there were approximately 1,565 housing starts with a total construction value of $481.7 million last month.  The average value of new home construction was highest in Orlando (average value: $308,008) in comparison to other Florida regions reviewed, and well more than half of all new residential construction activity took place in the counties of Orange (536 permits) and Brevard (292 permits).

Jacksonville

Last month, there were more than 1,400 housing starts with a total construction value of nearly $335.5 million in the Jacksonville area.  The average value of new home construction was lowest in Jacksonville (average value: $239,255) in comparison to other regions reviewed, and the majority of all new permits originated from the counties of Duval (490 permits) and St. Johns (472 permits).

Southeast

In the southeastern region of Florida there were more than 1,135 housing starts with a total construction value of $334.5 million last month.  The average value of new home construction landed on the higher end of the spectrum (average value: $294,500) in comparison to other Florida regions reviewed, and the county with the greatest concentration of new residential construction activity was St. Lucie (512 permits).

To gain more information on the builders, homeowners and permits for the construction activity above, check out HBW for your copy of the latest construction data reports. To gain access to the HBW database and receive custom and detailed reports on the latest residential and commercial building activity in Florida, Georgia, Texas, Alabama, and Oklahoma, please contact HBW for details.

Texas Swimming Pool Construction Review – January 2021

A review of the latest permit data for new swimming pool construction in Texas during the month of January 2021

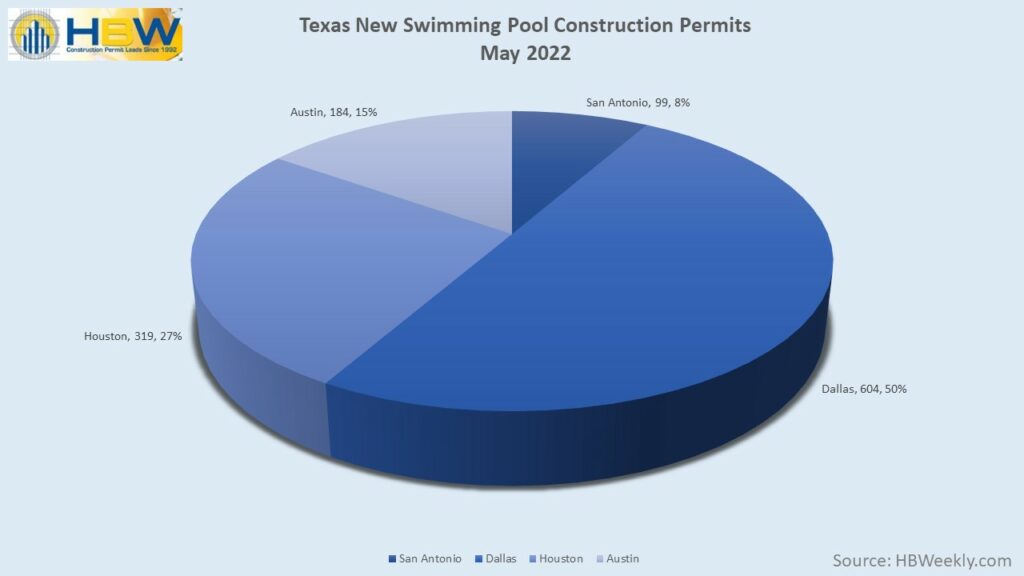
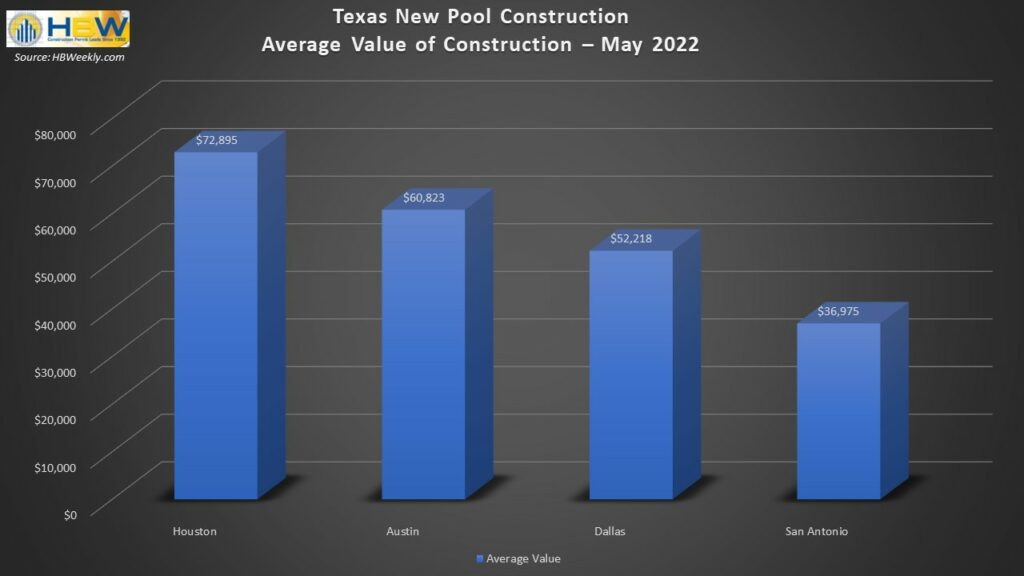
Every month on the blog, HBW provides insight into the latest permit data for new residential and swimming pool construction in various regions throughout the southern U.S., and today we are taking a look at the latest construction data for new swimming pool construction in the four major metro areas of Austin, Dallas, Houston and San Antonio during the month of January 2021.

Out of the four metro areas reviewed, Dallas carried the greatest volume of pool starts, while Austin held the highest average value of new pool construction last month.

Here is a quick look at the total permits, average value of construction, leading counties and top contractors for new pool construction in Texas during the month of January 2021:

Dallas

Last month, Dallas carried the highest volume of new swimming pool construction, having nearly 445 new permits with a total construction value of approximately $19 million.  The average value of new pool construction was $42,744, and the county with the highest concentration of new permits was Collin County (144 permits).

Out of the 165 active contractors in the Dallas area last month, the following ranked as the top three for total new permits on record with HBW for the one-month period:

#1 – Riverbend Pools

#2 – Hobert Pools

#3 – Puryear Custom Pools

Houston

In the Houston area, there were more than 350 new swimming pool permits with a total construction value of approximately $21.4 million last month.  The average value of new pool construction was $60,521, and the majority of construction activity took place in Harris County (215 permits).

Out of the more than 150 pool builders with new construction activity in the Houston area last month, the following ranked as the top three for total new permits on record with HBW for the one-month period:

#1 – Platinum Pools

#2 – Anthony & Sylvan Pools

#3 – Cypress Custom Pools

Austin

In the Austin area, there were nearly 120 pool starts with a total construction value of $8.4 million last month.  The average value of new pool construction was highest in Austin (average value: $71,087) in comparison to other Texas areas reviewed, and the bulk of permits originated from Travis County (72 permits).

Out of the approximately 50 pool contractors with new construction activity in the Austin area last month, the following ranked as the top three for total new permits on record with HBW for the one-month period:

#1 – Cody Pools

#2 – Anthony & Sylvan Pools

#3 – Majestic Poolscape

San Antonio

Last month, there were 46 new swimming pool permits with a total construction value of $1.2 million on record for the San Antonio area.  The average value of construction was lowest in San Antonio (average value: $25,761) in comparison to other areas reviewed, and more than half of all permits originated from Bexar County where there were 28 pool starts for the one-month period.

Out of the 25 active contractors in the San Antonio area last month, the following ranked as the top three for total new permits on record with HBW for the one-month period:

#1 – Keith Zars Pools

#2 – Blue Haven Pools

#3 – Alamo Pool Builders

To gain more information on the builders, homeowners and permits for the construction activity above, check out HBW for your copy of the latest construction data reports. To gain access to the HBW database and receive custom and detailed reports on the latest residential and commercial building activity in Florida, Georgia, Texas, Alabama, and Oklahoma, please contact HBW for details.
Texas Top Home Builders – January 2021

A review of the leading home builders in Texas during the month of January 2021

Earlier this week, we reviewed the latest permit data on record with HBW for new home construction in Texas and discovered approximately 7,515 housing starts with a total construction value of nearly $1.7 billion for the month of January.

Today, we are taking a deeper dive into the same construction data reports to identify the leading home builders driving new construction in each of the four major metro regions of Texas (Houston, Dallas, Austin, San Antonio).

Statewide, one major builder has maintained a strong hold on the market – D.R. Horton ranks as the #1 home builder for new residential construction in Texas, having approximately 1,400 new permits on record for the one-month period.

Here is a list of the top five home builders, corresponding permit totals and average value of construction by region in Texas last month:

Houston

Last month, there were nearly 315 home builders with new construction permits on record with HBW in the Houston area, and the following ranked as the top five for total new permits:

Builder Total Permits  Average Value
1-D.R. Horton 757  $      133,068.00
2-Lennar Homes 292  $      159,562.00
3-Perry Homes 218  $      259,429.00
4-Meritage Homes 167  $      153,976.00
5-K Hovnanian Homes 166  $      129,039.00

Dallas

In Dallas, there were more than 200 home builders with new construction activity on record last month, and the following ranked as the top five for total new permits for the one-month period:

Builder Total Permits  Average Value
1-D.R. Horton 381  $      192,007.00
2-Bloomfield Homes 129  $      320,747.00
3-Trophy Signature Homes 94  $      265,510.00
4-LGI Homes 93  $      201,023.00
5-Meritage Homes 73  $      183,153.00

Austin

Last month, there were approximately 100 home builders with new construction activity on record in the Austin area, and the following ranked as the top five for total new permits:

Builder Total Permits  Average Value
1-D.R. Horton 253  $      209,733.00
2-Lennar Homes 150  $      156,544.00
3-Pulte Homes 107  $      316,043.00
4-Meritage Homes 78  $      254,515.00
5-Chesmar Homes 64  $      332,069.00

San Antonio

In the San Antonio area, there were more than 85 contractors with new home construction activity on record last month, and the following ranked as the top five for total new permits on record with HBW:

Builder Total Permits  Average Value
1-Meritage Homes 33  $  217,125.00
2-Gehan Homes 25  $  259,204.00
3-KB Homes 22  $  233,455.00
4-Liberty Home Builders 16  $  307,748.00
5-HVH Homes 14  $  252,070.00

To gain more information on the builders, homeowners and permits for the construction activity above, check out HBW for your copy of the latest construction data reports. To gain access to the HBW database and receive custom and detailed reports on the latest residential and commercial building activity in Florida, Georgia, Texas, Alabama, and Oklahoma, please contact HBW for details.
HBW Report: Texas Residential Construction – January 2021

A review of the latest construction data based on residential construction permits added to the HBW database during the month of January 2021

Last month, there were approximately 7,515 housing starts with a total construction value of nearly $1.7 billion in Texas.  Out of the four major metro areas reviewed (Houston, Dallas, Austin, San Antonio), Houston carried the greatest volume of new residential construction (3,658 permits), while the highest average value of new home construction could be found in the San Antonio area (average value: $272,413).

Here is a closer look at the permit data for new residential construction in Texas by metro area during the month of January 2021:

Houston

As previously noted, there were nearly 3,660 housing starts with a total construction value of approximately $681.5 million.  The average value of new home construction was lowest in Houston (average value: $186,299) in comparison to other metro areas reviewed, and the majority of new construction activity took place in Harris County (2,097 permits).

Dallas

In Dallas, there were approximately 2,240 housing starts with a total construction value of nearly $581.5 million last month.  The average value of new home construction was $259,705, and the county with the highest concentration of new residential construction activity was Tarrant County with 764 permits for the one-month period.

Austin

Last month, there were approximately 1,310 housing starts with a total construction value of nearly $335.5 million in the Austin area.  The average value of new home construction was $256,266, and more than half of all new permits originated from Williamson County where there were 682 permits on record for the one-month period.

San Antonio

In San Antonio, there were nearly 310 housing starts with a total construction value of approximately $84 million last month.  The average value of new home construction was highest in San Antonio (average value: $272,413) in comparison to other Texas metro areas reviewed, and nearly half of all new construction activity took place in Comal County where there were 144 new permits on record for the one-month period.

To gain more information on the builders, homeowners and permits for the construction activity above, check out HBW for your copy of the latest construction data reports. To gain access to the HBW database and receive custom and detailed reports on the latest residential and commercial building activity in Florida, Georgia, Texas, Alabama, and Oklahoma, please contact HBW for details.

3 Tips for Contractor Marketing Success

At the start of this year, we published Quick Tips for Digital Marketing Success in 2021 where we explored easy ways to improve digital marketing efforts in the coming year.  Today, we are expanding the set of tips to cover marketing efforts that can specifically benefit contractors and their businesses.

Here are three ways for contractors to amp up their marketing efforts, both on and offline:

Referral Program – When you think about it, you are probably already involved in multiple referral programs as a consumer without even knowing it.  As powerful as social media and other digital marketing efforts are today, word of mouth advertising still reigns supreme as it is most likely to lead to repeat and long-term customers, as well as generate more than twice the sales of advertising (source: McKinsey & Company).  Referral programs are not limited to just incentive-based “reward” or “discount” programs; while discounts provide solid incentives, they are simply not the easiest for contractors to execute with their one-time services or service-based businesses.  For this reason, contractor referral programs should take a broader approach in the form of feedback, reviews and testimonials that can be shared across a variety of platforms and within various mediums.  In order to gain the most return out of positive feedback, you must share it; this means more than just a retweet here and there – Consider incorporating it in your mailers, on your website and within promotional videos, flyers and even proposals.

Seasonal Specials – Seasonal campaigns are an easy and effective way to get on your customers’ radars with information that they are already thinking about or relate to at a specific time of year.  Many people think of the holidays when thinking of seasonal campaigns, but for contractors actual seasons drive information as there are property preparations required for hurricane season, snowfall, summer heat, etc. – The change in the seasons offers opportunities to connect to customers with information, products and services that they are currently seeking to make their lives easier in managing their properties based on the changing conditions.  For this reason, create a schedule for your campaigns to push your seasonal products and services to the forefront of your marketing efforts at the optimal time of year.

Keep Networking – Leads do not generate themselves. There are numerous ways to keep your leads fresh and updated, including using lead service providers like HBW, launching whitepapers that require contact data collection, surveys, and contests/giveaways.  Whatever method you choose, make sure your leads are verified and that you diligently track and manage results. Also, track your referral programs and attend trade association, chamber of commerce and local networking events – many events are virtual right now so you can stay connected while staying safe.

For more information on construction business marketing tips, stay connected with the HBW Blog.  To get ahead of construction activity and gain access to the latest permitting data in Florida, Texas, Georgia, Alabama and Oklahoma, contact HBW for more information on construction data reports and industry leads.

Mark Your Calendar: Industry Conventions Winter 2021

A review of the new face of industry expos and a few events to keep in mind as you plan to “get back out there” in the coming months

With the pandemic came a loss of gatherings for every industry, but for builders, some main staple events were truly missing.  It has been approximately one year since industry professionals have been able to gather together for networking, product viewings and continuing education in the hands-on and in-person format that only an Expo and Conference can offer.

That being stated, the last year has given many businesses, trade associations and event planners time to amp up their game when it comes to virtual events.  The good news for construction professionals is that many of the event once attended in person are still alive and kicking online, providing the same educational opportunities but without the overhead of travel and accommodations and higher entry fees.  Even better, everyone can stay safe while staying connected to the latest trends, products and leaders in the industry.

For this reason, here is a list of a few events that you may want to consider in the coming month or so:

International Builders Show – IBS is currently underway (February 9-12, 2021) and offering virtual attendance in what is now being referred to as IBSX – Registration to the event provides: Access to 100+ IBS education sessions; access to IBS and KBIS Virtual exhibitors; Access to IBS networking and demos.  Registration is free for members and as low as $50 for non-members to register for a virtual pass.  Learn more at www.buildersshow.com.

International Roofing Expo -Virtual Edition (March 2-4, 2021) – The IRE 2021 Virtual Conference and Expo will feature both live and on-demand educational sessions, a virtual exhibit directory, a product directory, and networking opportunities.  As per their website, IRE is where contractors, remodelers, and builders connect with manufacturers to discover the latest products, technologies, and services on the market while further developing professional and technical skills. Content is curated, vetted, and presented by trailblazers in the roofing and exterior construction industries. This year will be the first ever IRE Virtual Edition event, and there are a variety of times available to connect to the event from the convenience of your smartphone, computer, or tablet.  You can learn more and register from the event website.

ASHRAE Virtual Design + Construction Conference (March 8-10, 2021) – The inaugural conference seeks to fill a need for ASHRAE members and practitioners using or planning to apply virtual design and construction in the design, construction and operation of HVAC systems.  According to the website, the conference offers in depth look at the current state-of-the-industry and near future outlook in such areas as virtual reality (VR), augmented reality (AR), machine learning, LiDAR Mapping, photogrammetry, and “digital twin” technologies as they are currently being applied to integrated design, building information modeling, project management, cost estimating, scheduling and sequencing, pre-fabrication, off-site construction, modular construction, robotics and automated installation, 3D printing, facility management, asset management and operations.  Registration includes 3 days of learning and live discussions, continuing education, live sessions that will be on-demand for one year after the conference, keynote speakers and daily networking opportunities.  To learn more, visit their website.

Build Expo USA Tampa (March 24-25, 2021) – If you are looking for an in-person experience, Build Expo USA Tampa (at the Tampa Convention Center) provides the building and construction industry an unrivaled environment to meet a lot of buyers all in one place. As American’s largest regional building and construction show producer, the event enables attendees to network with thousands of building and construction professionals, as well as take advantage of the more than 30 complimentary leading industry classes.  To learn more, visit the show website here.

For more information on construction business and marketing tips, stay connected with the HBW Blog.  To get ahead of construction activity and gain access to the latest permitting data in Florida, Texas, Georgia, Alabama and Oklahoma, contact HBW for more information on construction data reports and industry leads.S

Annual Review: Florida Swimming Pool Construction 2020

A review of permit data on record with HBW for new swimming pool construction in Florida throughout 2020

As noted in the graph above, new swimming pool construction has been on a steady climb in Florida since 2011, and in 2020, there was a surge in the market – From January through December of last year, there have been approximately 32,715 new swimming pool permits added to the HBW database, reflecting a notable 27 percent year-over-year increase in new swimming pool construction activity in the Sunshine State.

In the six regions reviewed (Southwest, Southeast, Northwest, Northeast, Central, West) there were marked increases in new pool construction ranging from 21 percent to 32 percent, with the highest concentration of new pool construction activity taking place in the southwestern region (8,815 permits) where there was a 25 percent year-over-year increase in new pool permits.

Here is a closer look at the total number of new permits on record in each Florida region reviewed, as well as leading counties and annual growth rates:

Southwest

As previously mentioned, the southwestern region of Florida experienced a 25 percent year-over-year increase in new pool construction last year, resulting in 8,815 new permits added to the HBW database.  Out of the five counties that make up the southwest, Lee County (2,925 permits) held the greatest volume of pool starts as there was a 37 percent annual uptick in new pool construction.

Southeast

The southeastern region of Florida exhibited the greatest annual increase in new pool construction last year, having a 32 percent year-over-year increase in new pool construction activity that resulted in nearly 6,200 new permits on record with HBW.  Out of the seven counties that make up the southeast, Palm Beach (~2,300 permits) was identified as having the highest concentration of new pool permits due to a 39 percent year-over-year increase in new pool construction.

West

Not far behind the southeast, the western region of Florida ranked #3 for new pool construction last year, having approximately 6,150 new permits which resulted from a 25 percent year-over-year increase in new pool construction activity.  Out of the seven counties that make up the area, more than half of all new permits originated from Hillsborough County (1,810 permits) and Pasco County (1,467 permits) where there were year-over-year increases in new pool construction of 17% and 46% respectively.

Central

Last year, Central Florida demonstrated a 28 percent year-over-year increase in new swimming pool construction, resulting in 5,080 new permits on record with HBW.  Out of the six counties reviewed, more than half of all new permits originated from the counties of Orange (1,847 permits) and Brevard (1,028) where there were year-over-year spikes in new construction of 27% and 16% respectively.

Northeast

In the northeastern region of Florida, there were approximately 3,380 new pool permits added to the HBW last year due to a 31 percent increase in new swimming pool construction activity.  Out of the eight counties that make up the northeast, more than half of all new construction took place in the counties of St. Johns (1,296 permits) and Duval (802 permits) where there were annual increases in pool construction of 49% and 22% respectively.

Northwest

Last year, there were approximately 3,100 pool starts in the northwest as a result of a 21 percent year-over-year increase in new swimming pool construction.  Out of the eighteen counties reviewed, the greatest concentration of new permits could be found in Santa Rosa County, where there was an 18 percent year-over-year increase in new pool construction that resulted in approximately 610 new permits added to the HBW database.

To gain more information on the builders, homeowners and permits for the construction activity above, check out HBW for your copy of the latest construction data reports. To gain access to the HBW database and receive custom and detailed reports on the latest residential and commercial building activity in Florida, Georgia, Texas, Alabama, and Oklahoma, please contact HBW for details.
Annual Report – Florida Residential Construction 2020

A review of new residential construction permit data on record with HBW for Florida from January through December 2020

The annual Building Activity Trend Reports for new residential construction in Florida have been released by HBW, and based on the totals published through the 4th quarter of 2020, there was a 17 percent year-over-year increase in new home construction, resulting in approximately 97,570 new permits on record with HBW.  The report was based on new residential construction permits from six major regions of Florida (Central, West, Southeast, Southwest, Northeast, Northwest), all of which exhibited year-over-year increases in new home construction ranging from 7 percent to 27 percent. 

Out of the six regions reviewed, the greatest concentration of housing starts could be found in West Florida, where there were 22,200 new residential construction permits on record, reflecting a 10 percent year-over-year increase in housing starts.

Here is a closer look at the reports and a breakdown of the total permits, annual increases in new construction activity, leading counties for housing starts and the totals for higher value properties in Florida last year:

West Florida

Total Permits: 22,200

% Annual Increase – YTD (2019 vs. 2020): +10%

Top County for New Construction: Polk County (7,024 permits)

Total Permits for Higher Value Homes (>$500k): 1,192

Southwest Florida

Total Permits: 18,297

% Annual Increase – YTD (2019 vs. 2020): +16%

Top County for New Construction: Lee County (6,125 permits)

Total Permits for Higher Value Homes (>$500k): 746

Northeast Florida

Total Permits: ~17,600

% Annual Increase – YTD (2019 vs. 2020): +27%

Top County for New Construction: Duval County (5,516 permits)

Total Permits for Higher Value Homes (>$500k): 416

Central Florida

Total Permits: 16,062

% Annual Increase – YTD (2019 vs. 2020): +21%

Top County for New Construction: Orange County (4,880 permits)

Total Permits for Higher Value Homes (>$500k): ~1,100

Northwest Florida

Total Permits: 13,130

% Annual Increase – YTD (2019 vs. 2020): +18%

Top County for New Construction: Santa Rosa County (2,275 permits)

Total Permits for Higher Value Homes (>$500k): 600

Southeast Florida

Total Permits: 10,281

% Annual Increase – YTD (2019 vs. 2020): +7%

Top County for New Construction: St. Lucie County (4,138 permits)

Total Permits for Higher Value Homes (>$500k): ~1,060


To gain more information on the builders, homeowners and permits for the construction activity above, check out HBW for your copy of the latest construction data reports. To gain access to the HBW database and receive custom and detailed reports on the latest residential and commercial building activity in Florida, Georgia, Texas, Alabama, and Oklahoma, please contact HBW for details.
Texas Annual Report: Swimming Pool Construction 2020

A review of permit data on record with HBW for new swimming pool construction in Texas during 2020

Earlier this week, we reviewed HBW Activity Trend Reports for new residential construction in Texas during 2020, and we identified flourishing markets across the state.  Today, we are taking a look at similar permit data and reports, but this time we are specifically covering construction figures for new swimming pool construction last year.

With a 29 percent year-over-year increase in new swimming pool construction permits in 2020, there appears to be a healthy and climbing demand for swimming pools in all four metro areas of Texas (Dallas, Houston, Austin, San Antonio).  From January through December, there were 11,412 pool starts, and each metro area experienced major annual spikes in new construction ranging from 23 percent to 33 percent.

Here is a closer look at the total permits and leading counties for new swimming pool construction in each of the four major metropolitan areas of Texas last year:

Dallas

Out of the four Texas regions reviewed, Dallas carried the highest volume of new pool permits last year, having 5,462 starts on record for the one-year period, reflective of a 29 percent year-over-year increase in permits.  Out of the six counties that make up the Dallas area, more than half of all new construction took place in Collin County (1,608 permits) and Tarrant County (1,412) where there were year-over-year increases in pool permits of 60 percent and 37 percent respectively.

Houston

In Houston, there were 3,713 pool starts last year, reflecting a 33 percent year-over-year increase in new swimming pool construction.  Out of the five counties that make up the Houston area, the bulk of new permits originated from the County of Harris where there were 2,159 permits for the year, reflecting a 26 percent year-over-year increase in new swimming pool construction.

Austin

Last year, there was a 24 percent year-over-year increase in new swimming pool construction in the Austin area, resulting in approximately 1,360 new permits on record with HBW.  Out of the four counties that make up the Austin area, Travis County held the greatest concentration of new pool construction activity, having nearly 930 permits on record with HBW for the 12-month period.

San Antonio

In San Antonio, there were nearly 880 new swimming pool construction permits added to the HBW database last year, reflecting a 23 percent year-over-year increase in new pool construction activity.  Out of the three counties that make up the San Antonio area, Bexar County held the greatest concentration of new construction activity, having approximately 610 new pool permits on record last year.

To gain more information on the builders, homeowners and permits for the construction activity above, check out HBW for your copy of the latest construction data reports. To gain access to the HBW database and receive custom and detailed reports on the latest residential and commercial building activity in Florida, Georgia, Texas, Alabama, and Oklahoma, please contact HBW for details.