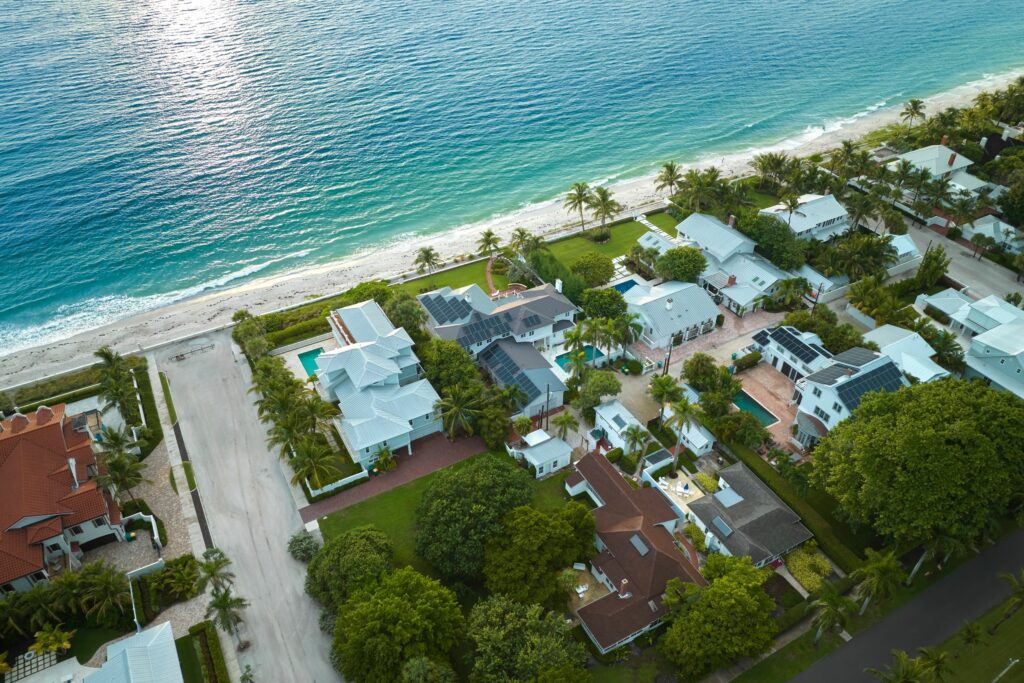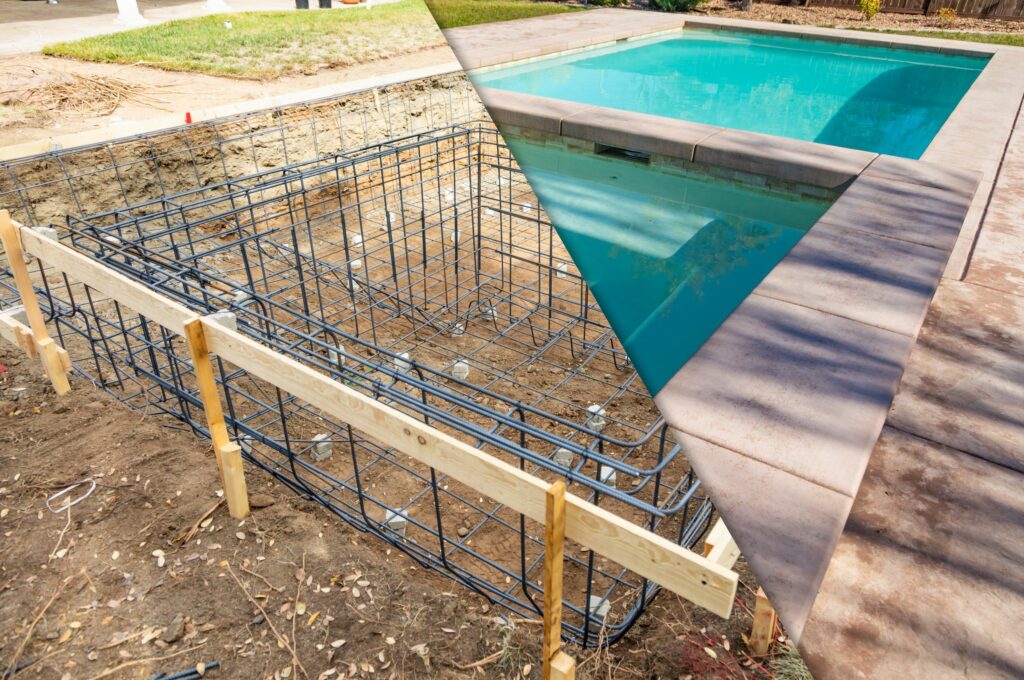
HBW Report: Florida’s Top Home Builders – January 2023

Highlighting the top ranked home builders in Florida based on the total number of new permits on record with HBW during the month of January.

Have you checked HBW’s construction data reports yet? If you are an HBW subscriber, then you have access to the latest and greatest construction permit data, building trend reports, and lead generation tools available.  Earlier this week, we used a January HBW construction data report for Florida residential construction, and we reported that there have been just over 6,370 new permits with a total value of nearly $2B added to the database for the month.

Today, we will be using the same reports to highlight the leading home builders across the five major regions of the Sunshine State (Southwest, Tampa, Orlando, Southeast, Jacksonville) …

Statewide, there are two primary players that continue to lead new home construction – D.R. Horton and Lennar Homes.  While each region’s top ranked contractors are varied and regionally based for the most part, both D.R. Horton and Lennar Homes have been consistently strong statewide, having 1,083 and 701 new permits on record respectively for the one-month period.  Out of the five regions reviewed, both home builders landed on the top five list in every single area.

Here is a closer look at the leading home builders based on the total number of new residential construction permits on record with HBW in Florida during the month of January 2023:

Southwest

In January, there were approximately 320 home builders with new permits on record in Southwest Florida, and the following ranked as the top five for total new permits:

BuilderTotal Permits Average Value
1-Lennar Homes204 $      175,412.00
2-Pulte Homes173 $      171,357.00
3-D.R. Horton146 $      213,220.00
4-Taylor Morrison54 $      229,007.00
5-Ordonez Construction53 $      191,981.00

Tampa

Out of more than 210 home builders with new residential construction activity on record in Tampa during the month of January, the following ranked as the top five for total new permits:

BuilderTotal Permits Average Value
1-D.R. Horton478 $      251,437.00
2-Lennar Homes325 $      307,372.00
3-The Villages Land Company241 $      175,000.00
4-Pulte Homes93 $      248,950.00
5-Ryan Homes64 $      260,090.00

Orlando

In Orlando, there were more than 160 home builders with new construction activity on record for January, and the following ranked as the top five for total new permits during the one-month period:

BuilderTotal Permits Average Value
1-D.R. Horton187 $      243,774.00
2-Pulte Homes79 $      411,090.00
3-Lennar Homes65 $      227,120.00
4-Minto Communities57 $      324,138.00
5-Meritage Homes35 $      258,343.00

Jacksonville

In January, there were 135 home builders with new construction activity on record with HBW in the Jacksonville area, and the following ranked as the top five for total new permits:

BuilderTotal Permits Average Value
1-D.R. Horton240 $      202,461.00
2-Summit Contracting Group126 $      184,269.00
3-Dream Finders Construction109 $      272,556.00
4-American Classic Homes94 $        85,000.00
5-Lennar Homes77 $      245,737.00

Southeast

Out of nearly 110 contractors with new residential construction activity on record for Southeast Florida during the month of January, the following ranked as the top five for total new permits:

BuilderTotal Permits Average Value
1-GL Building Corporation83 $      480,078.00
2-D.R. Horton32 $      240,691.00
3-Holiday Builders31 $      283,536.00
4-Lennar Homes30 $      177,413.00
5-Pulte Homes29 $      434,201.00

To gain more information on the builders, homeowners and permits for the construction activity above, check out HBW for your copy of the latest construction data reports. To gain access to the HBW database and receive custom and detailed reports on the latest residential and commercial building activity in Florida, Georgia, Texas, Alabama, and Oklahoma, please contact HBW for details.

Florida New Home Construction Report – January 2023

An overview of permit data for new residential construction in Florida during the month of January 2023

In January, there were just over 6,370 new residential construction permits with a total value of nearly $2B added to the HBW database for the Sunshine State; this figure reflects a 7 percent month-over-month decrease in new home construction.  Out of the five Florida regions reviewed (Tampa, Southwest, Orlando, Jacksonville, Southeast), the Tampa area (1,935 permits) held the highest concentration of new residential construction activity, while the southeastern region carried the highest average value of new home construction (average value: $360,709).

Here is a closer look at the total permits, construction values and leading counties for new residential construction throughout Florida during the month of January 2023:

Tampa

As previously mentioned, Tampa ranked #1 for new home construction last month, having 1,935 new permits on record with a total construction value of $527M.  The average value of construction in Tampa was $272,370, and more than half of all new permits originated from the counties of Pasco (819 permits) and Sumter (353 permits).

Southwest

Not far behind Tampa, the southwestern region of Florida ranked #2 for new residential construction as there were 1,710 new permits with a total construction value of nearly $556M last month.  The average value of new construction was $325,333, and more than half of all new permits originated from Lee County (485 permits) and Collier County (433 permits).

Jacksonville

Last month, there were more than 1,150 new residential construction permits with a total value of nearly $296M in the Jacksonville area.  The average value of new home construction was lowest in Jacksonville (average value: $256,431) in comparison to other Florida regions reviewed, and the majority of new permits originated from the counties of Duval (527 permits) and St. Johns (356 permits).

Orlando

In Orlando, there were approximately 1,050 new residential construction permits with a total value in excess of $355M on record with HBW last month.  The average value of new home construction landed on the higher end of the spectrum in Orlando (average value: $338,485) in comparison to other Florida regions reviewed, and nearly half of all new residential construction activity took place in the counties of Brevard (256 permits) and Orange (234 permits).

Southeast

In the southeastern region of Florida there were 525 new residential construction permits with a total value of approximately $189.4M last month.  The average value of new home construction was highest in the southeast (average value: $360,709) in comparison to other Florida regions reviewed, and the counties with the greatest concentration of new residential construction activity were St. Lucie (224 permits) and Palm Beach (132 permits).

To gain more information on the builders, homeowners and permits for the construction activity above, check out HBW for your copy of the latest construction data reports. To gain access to the HBW database and receive custom and detailed reports on the latest residential and commercial building activity in Florida, Georgia, Texas, Alabama, and Oklahoma, please contact HBW for details.

Florida Swimming Pool Construction Review – January 2023

An HBW report on new swimming pool construction permitting activity in Florida during the month of January 2023

Last month, there were 2,190 new swimming pool construction permits added to the HBW database for the Sunshine State.  Out of the five major regions reviewed (Southwest, Tampa, Orlando, Southeast and Jacksonville), the greatest concentration of new pool construction could be found in the southwestern region (710 permits), and the highest average value of new construction could be found in Jacksonville (average value: $88,183).  Here is a breakdown of the new swimming pool permits on record with HBW for the month of January 2023:

Southwest

The Southwest ranked #1 for new pool construction last month, having 710 new permits with a total construction value in excess of $48 million.  The average value of construction was $67,714, and the highest concentration of new permitting activity took place in the counties of Lee (149 permits) and Collier (263 permits).

Out of nearly 160 pool builders with new construction activity recorded for the month, the following ranked as the top three for total new permits:

BuilderTotal Permits
1-Pinnacle USA47
2-Casa Pools47
3-Aragon Pools & Spas46

Southeast

Last month, the southeast ranked #2 for new pool construction, having approximately 475 new pool permits with a total construction value of nearly $33.5million.  The average value of construction was $70,661, and the majority of permits originated from the two counties of Palm Beach (159 permits) and Broward (98 permits).

Out of more than 180 contractors with new pool construction activity on record in the southeast last month, the following ranked as the top three for total new permits:

BuilderTotal Permits
1-A&G Concrete Pools26
2-Van Kirk Construction21
3-Fountain Blue Pool Service20

Tampa

Tampa ranked #3 for new pool construction, having more than 430 permits with a total construction value of nearly $30 million last month.  The average value of new pool construction was $68,742, and close to half of all new permits originated from the counties of Polk (113 permits) and Hillsborough (87 permits).

Out of approximately 145 pool builders with new construction activity on record last month, the following ranked as the top three for total new permits:

BuilderTotal Permits
1-Central Florida Pools32
2-Cody Pools23
3-T&D Pool & Spa Construction22

Orlando

In the Orlando area, there were more than 365 new swimming pool construction permits with a total value of $25.6 million on record last month. The average value of construction was $69,987, and the majority of permits originated from the counties of Orange (113 permits) and Brevard (78 permits).

There were nearly 110 pool contractors with new permits on record in Orlando last month, and the following ranked as the top three for total new permits:

BuilderTotal Permits
1-All Seasons43
2-Dreamscapes Pools & Spas32
3-American Pools & Spas20

Jacksonville

In Jacksonville, there were nearly 210 new swimming pool construction permits with a total value in excess of $18.4 million added to the HBW database last month.  The average value of construction was highest in Jacksonville (average value: $88,183) in comparison to other regions reviewed, and nearly half of all new permits originated from St. Johns County (100 permits).

Out of the 75 contractors with new pool construction activity on record in the area last month, the following ranked as the top three for total new permits:

BuilderTotal Permits
1-Agua Pools & Spas13
2-Blue Haven Pools13
3-Epic Pools & Hardscape Const10

To gain more information on the builders, homeowners and permits for the construction activity above, check out HBW for your copy of the latest construction data reports. To gain access to the HBW database and receive custom and detailed reports on the latest residential and commercial building activity in Florida, Georgia, Texas, Alabama, and Oklahoma, please contact HBW for details.

Texas Top Home Builders – January 2023

A review of the leading home builders in the Lone Star State during the month of January

Last week, we reviewed the latest permit data for new residential construction activity in Texas and reported that there were approximately 3,540 new permits with a total value of $1.1 billion on record for the month of January.  This week, we are using the same HBW construction data reports to identify the leading home builders that have been driving construction since the start of the year (January).

Based on the latest reports, three home builders were standouts, carrying more than 20 percent of all new residential construction activity:

1 – Lennar Homes (394 permits)

2- D.R. Horton (230 permits)

3 – Perry Homes (141 permits)

Here is a closer look at the leading home builders in each of the four major metro regions of Texas last month:

Dallas

In Dallas, there were 265 home builders with new permits on record with HBW for the month of January, and the following ranked as the top five for total new permits:

BuilderTotal Permits Average Value
1-Lennar Homes190 $      230,439.00
2-Highland Homes81 $      363,748.00
3-D.R. Horton68 $      288,658.00
4-First Texas Homes46 $      425,974.00
5-Meritage Homes45 $      256,268.00

Houston

Last month, there were nearly 310 contractors with new residential permits added to the HBW database for the Houston area, and the following ranked as the top five for total new permits:

BuilderTotal Permits Average Value
1-Lennar Homes132 $      158,211.00
2-Perry Homes61 $      375,851.00
3-HHS Residential60 $      300,000.00
4-D.R. Horton56 $      183,806.00
5-Pulte Homes43 $      312,063.00

Austin

Out of approximately 85 home builders with new permits on record for the month in the Austin area, the following companies ranked in the top five for total new permits:

BuilderTotal Permits Average Value
1-D.R. Horton106 $      182,758.00
2-Chesmar Homes44 $      422,254.00
3-Lennar Homes40 $      188,420.00
4-KB Homes35 $      222,227.00
5-Starlight Homes32 $      241,825.00

San Antonio

In San Antonio, there were 80 contractors with new residential construction activity on record last month, and the following ranked as the top five for total new permits:

BuilderTotal Permits Average Value
1-Lennar Homes32 $  157,915.00
2-Perry Homes30 $  410,294.00
3-Chesmar Homes11 $  560,018.00
4-Rausch Coleman Homes8 $  127,372.00
5-KB Homes7 $  200,175.00

To gain more information on the builders, homeowners and permits for the construction activity above, check out HBW for your copy of the latest construction data reports. To gain access to the HBW database and receive custom and detailed reports on the latest residential and commercial building activity in Florida, Georgia, Texas, Alabama, and Oklahoma, please contact HBW for details.
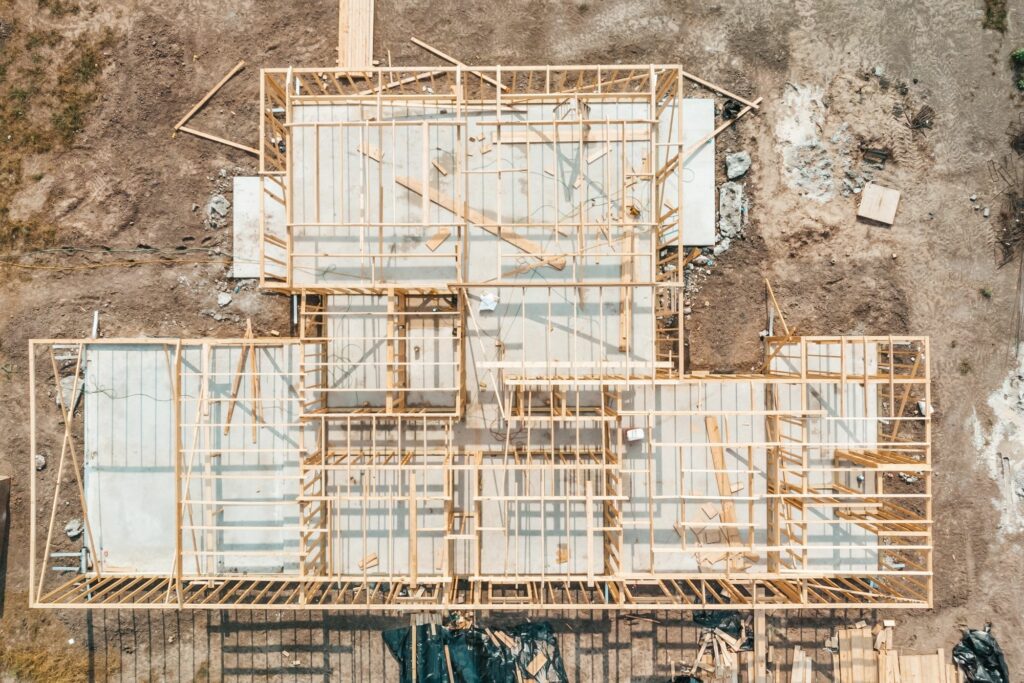
Texas Home Building Report – January 2023

A summary of permit data for new home construction in Texas during the month of January

New residential construction in Texas is off to a slow start this year.  Last month, Texas experienced a 34 percent month-over-month decrease in new residential construction, resulting in approximately 3,540 new permits on record with a total value of $1.1 billion.  Out of the four metro areas reviewed (Dallas, Houston, Austin, San Antonio), the greatest volume of housing starts could be found in the Houston area where there were 1,400 new permits, while the highest average value of new construction could be found in Dallas (average value: $345,247).

Here is a closer look at the total permits, values, and leading counties for new home construction throughout the Lone Star State last month:

Houston

As noted above, Houston ranked #1 for having the most new residential construction permits on record last month. In Houston, there were 1,400 new permits with a total construction value of nearly $383 million added to the HBW database. The average value of new home construction was lowest in Houston (average value: $273,406) in comparison to other Texas areas reviewed, and the county with the highest concentration of new residential construction activity was Harris County (809 permits).

Dallas

Not far behind Houston, Dallas ranked #2 for new residential construction last month, having 1,388 new permits with a total value in excess of $479.2 million on record with HBW.  Out of the six counties that make up the Dallas area, more than half of all new construction took place in Collin (387 permits) and Dallas (337 permits).

Austin

Last month, there were nearly 540 new residential construction permits with a total value of approximately $181.5 million in the Austin area.  The average value of new home construction landed on the higher end of the spectrum (average value: $337,346) in relation to other Texas areas reviewed, and well more than half of all new permits originated from Travis County (309 permits).

San Antonio

In San Antonio, there were 215 new residential construction permits with a total value in excess of $61.5 million last month.  The average value of new home construction was $286,186, and the county with the greatest concentration of new residential construction activity was Bexar County (137 permits).

To gain more information on the builders, homeowners and permits for the construction activity above, check out HBW for your copy of the latest construction data reports. To gain access to the HBW database and receive custom and detailed reports on the latest residential and commercial building activity in Florida, Georgia, Texas, Alabama, and Oklahoma, please contact HBW for details.

HBW Report: Texas Swimming Pool Construction – January 2023 

A review of the latest permit data for new swimming pool construction taking place in Texas during the month of January

Based on the latest construction data reports from HBW, there were approximately 640 new swimming pool construction permits with a total value in excess of $35.7 million added to the HBW database for Texas last month.  Out of the four major metro areas reviewed (Dallas, Houston, Austin and San Antonio), Dallas held the greatest amount of new swimming pool construction activity (319 permits), while the Houston area carried the highest average value of new pool construction (average value: $64,986).

Here is breakdown of the report data, from total permits and average value of construction to the leading contractors across Texas during the month of January 2023:

Dallas

As previously mentioned, Dallas ranked #1 for swimming pool construction last month, having approximately 320 new permits with a total construction value of $19 million.  The average value of construction was $59,648, and more than half of all new permits originated from the counties of Dallas (108 permits) and Collin (79 permits).

Out of more than 145 pool builders with new construction on record in the Dallas area last month, the following ranked as the top three for total new permits:

BuilderTotal Permits
1-Riverbend Pools24
2-Gold Medal Pools17
3-BMR Pools14

Houston

The Houston area ranked #2 for swimming pool construction last month as there were more than 160 new permits with a total value in excess of $10.5 million.  The average value of new swimming pool construction was highest in Houston in comparison to other metro areas reviewed (average value: $64,986), and more than half of all new permits originated from Harris County (97 permits).

Out of approximately 105 active contractors with new swimming pool construction activity on record last month, the following ranked as the top three for total new permits:

BuilderTotal Permits
1-Platinum Pools12
2-Anthony & Sylvan Pools11
3-Premier Pools5

Austin

In Austin, there were more than 105 new swimming pool construction permits with a total value of nearly $4.3 million on record with HBW last month.  The average value of construction was $40,390, and nearly all new permits were derived from Travis County (82 permits).

Out of approximately 55 contractors with new swimming pool construction activity on record last month, the following ranked as the top three for total new permits:

BuilderTotal Permits
1-Cody Pools12
2-Anthony & Sylvan Pools10
3-Denali Pools7

San Antonio

San Antonio had the least amount of new swimming pool construction activity on record last month, having just over 50 new permits with a total value of $1.9 million.  The average value of new pool construction was lowest in San Antonio (average value: $37,379) in comparison to other regions reviewed, and the majority of all new construction took place in Bexar County where there were 40 new permits on record for the one-month period.

Out of more than 25 pool contractors with new construction activity on record for the month, the following ranked as the top three for total new permits:

BuilderTotal Permits
1-Keith Zars Pools13
2-Gary Pools5
3-Infinity Pools of Texas3

To gain more information on the builders, homeowners and permits for the construction activity above, check out HBW for your copy of the latest construction data reports. To gain access to the HBW database and receive custom and detailed reports on the latest residential and commercial building activity in Florida, Georgia, Texas, Alabama, and Oklahoma, please contact HBW for details.

Florida Swimming Pool Construction Review – 2022

An overview of permit data for new swimming pool construction taking place in Florida during 2022

After several consecutive years of gaining upward momentum, new swimming pool construction appears to have slowed across the Sunshine State. Last year, there were more than 38,870 new swimming pool construction permits added to the HBW database for Florida, reflecting a 7 percent year-over-year decrease in new pool construction activity.

Out of the six regions that are included in the report (Southwest, Southeast, West, Central, Northeast, Northwest), the southwestern region (11,537 permits) carried the greatest concentration of new pool construction activity, while the lowest level of new construction could be found in the Northwest (3,425 permits). All regions, with the exception of the Northwest, demonstrated annual decreases in new construction ranging from -2 percent to -16 percent.

Here is a closer look at the total permits, leading counties, and annual % change in new pool construction across the state and by region:

Southwest

As previously noted, the highest concentration of new pool construction could be found in the southwestern region of the state where there was a 16 percent year-over-year decrease in new pool construction, resulting in 11,537 new permits for the year. Out of the five counties that make up the region, Lee County held the greatest volume of new permits (3,569 permits), while the fewest permits originated from Charlotte County (1,351 permits).

Southeast

Last year, there were 7,633 new permits added the the HBW database for the southeast, reflecting a 7 percent year-over-year decrease in new pool construction. Out of the seven counties included in the report for the area, more than 90 percent of all new construction could be found in Palm Beach (2,624 permits), Miami-Dade (1,827 permits), and Broward (1,263 permits).

West

In the western region of Florida, there were more than 6,900 new swimming pool permits added to the HBW database last year, reflecting a 2 percent year-over-year decrease in new pool construction. Out of the seven counties that make up the region, Hillsborough carried the highest concentration of new construction activity (2,021 permits) having experienced a 29 percent year-over-year increase in new pool construction.

Central

Last year, Central Florida demonstrated a 3 percent year-over-year decrease in new pool construction, resulting in nearly 5,490 new permits on record with HBW. Out of the six counties that make up the area, more than half of all new construction could be found in Orange (1,967 permits) and Brevard (1,101 permits).

Northeast

In the northeastern region of Florida, there were 3,885 new permits added to the HBW database for 2022, reflecting a stable market with little to no change from the previous year. Out of the eight counties that were included in the regional report, nearly 60 percent of all new pool construction could be found in St. Johns (1,448 permits) and Duval (773 permits).

Northwest

As previously noted, the northwestern region of the state experienced the lowest level (3,425 permits) of new pool construction last year; that being stated, it is the only area that demonstrated growth over the previous year, having a 4 percent year-over-year increase in new swimming pool construction permits. Out of the eighteen counties (16 FL counties and 2 AL counties) that were included in the regional report, nearly 55 percent of all new construction originated from the counties of Baldwin, AL (653 permits), Walton, FL (635 permits), and Santa Rosa, FL (532 permits).

To gain more information on the builders, homeowners and permits for the construction activity above, check out HBW for your copy of the latest construction data reports. To gain access to the HBW database and receive custom and detailed reports on the latest residential and commercial building activity in Florida, Georgia, Texas, Alabama, and Oklahoma, please contact HBW for details.

Annual Report: Florida New Home Construction 2022

A review of permit data for new residential construction in Florida during 2022

Based on HBW’s latest “Building Activity Trend Report”, new residential construction in Florida appears to have slowed over the last year. Since 2011, the market had been on upward trajectory, reflecting annual increases as high as 32 percent or more, but in 2022, the growth pattern took a downward turn. From January 1st to December 31, 2022, there was a 5 percent year-over-year decrease in new home construction in the Sunshine State, resulting in 123,085 new permits on record with HBW.

Out of the six major regions reviewed (Northwest, Northeast, Southwest, Southeast, West, Central), there was not a single area that exhibited growth over the last year. That being stated, the regions with the greatest concentration of new permits on record for the one-year period include West Florida (28,308 permits) and Southwest Florida (28,531 permits).

Here is a breakdown of the total residential construction permits, annual comparisons, and leading counties by Florida region in 2022:

Southwest Florida

Total permits: 28,531

% Change in total permits (in comparison to 2021): -3 percent

Top county for total permits: Lee (8,997 permits)

Total permits representing “high value” (>$500k) properties: 2,345 permits

West Florida

Total permits: 28,308

% Change in total permits (in comparison to 2021): -4 percent

Top county for total permits: Hillsborough (6,464 permits)

Total permits representing “high value” (>$500k) properties: 2,307 permits

Northeast Florida

Total permits: 23,454

% Change in total permits (in comparison to 2021): -3 percent

Top county for total permits: Marion (5,736 permits)

Total permits representing “high value” (>$500k) properties: 1,083 permits

Central Florida

Total permits: 18,822

% Change in total permits (in comparison to 2021): -0 percent

Top county for total permits: Orange (4,272 permits)

Total permits representing “high value” (>$500k) properties: 1,802 permits

Northwest Florida

Total permits: 13,065

% Change in total permits (in comparison to 2021): -7 percent

Top county for total permits: Bay (2,395 permits)

Total permits representing “high value” (>$500k) properties: 1,343 permits

Southeast Florida

Total permits: 10,905

% Change in total permits (in comparison to 2021): -16 percent

Top county for total permits: St. Lucie (4,537 permits)

Total permits representing “high value” (>$500k) properties: 1,655 permits

To gain more information on the builders, homeowners and permits for the construction activity above, check out HBW for your copy of the latest construction data reports. To gain access to the HBW database and receive custom and detailed reports on the latest residential and commercial building activity in Florida, Georgia, Texas, Alabama, and Oklahoma, please contact HBW for details.
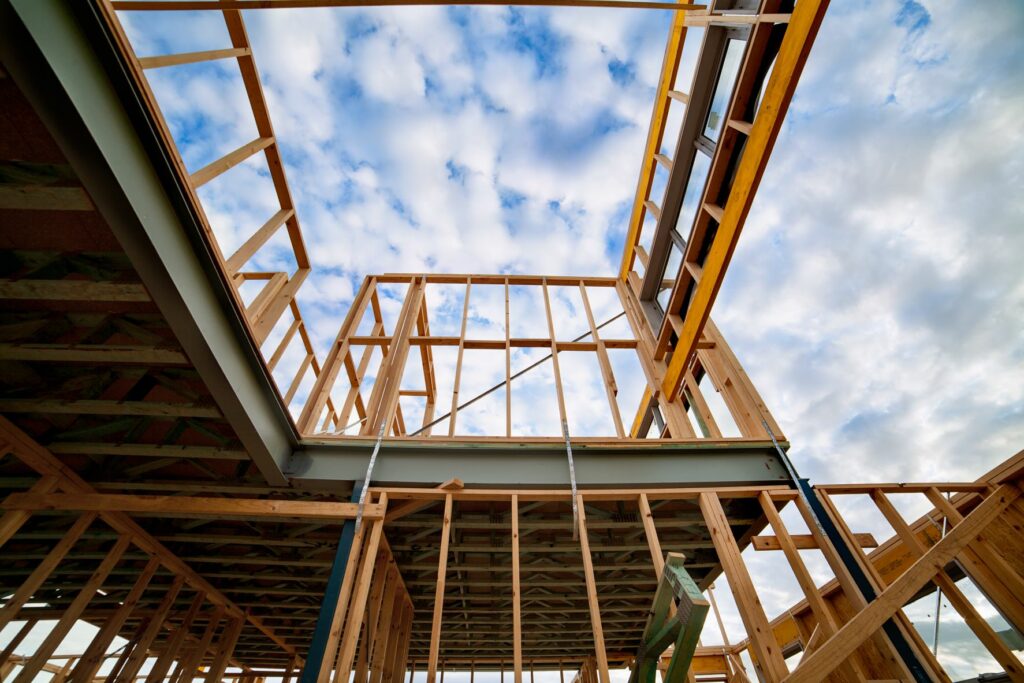
Annual Review: Texas Swimming Pool Construction – 2022

An overview of permit data for new swimming pool construction in Texas during 2022

Earlier this week, we reviewed the most recent HBW Activity Trend Reports for new residential construction in Texas during 2022, and today we will be taking a look at similar permit reports to uncover the latest data on swimming pool construction in the Lone Star State last year.

Statewide, there was just a 1 percent year-over-year increase in new swimming pool construction permits in 2022; based on the latest data, there appears to be a consistent and steady demand for swimming pools in nearly all four metro areas included in the report (Dallas, Houston, Austin, San Antonio).  From January through December, there were 13,234 new swimming pool construction permits added to the HBW database for Texas, with the greatest annual growth taking place in Austin (+48% YOY) and the highest concentration of new permits originating from the Dallas area (6,244 permits).

Here is a closer look at the total permits and leading counties for new swimming pool construction in each of the four major metropolitan areas of Texas last year:

Dallas

Out of the four Texas regions reviewed, Dallas carried the highest volume of new pool construction last year, having 6,244 permits on record for the one-year period, reflecting steady and consistent activity that is on par with the previous year.  Out of the six counties that make up the Dallas area, nearly half of all new construction took place in Collin County (1,626 permits) and Tarrant County (1,442 permits).

Houston

In Houston, there were 3,792 new swimming pool construction permits added to the HBW database last year, reflecting a 15 percent year-over-year decrease in new swimming pool construction.  Out of the five counties that make up the Houston area, the bulk of new permits originated from Harris County where there were 2,152 permits on record for the year.

Austin

Last year, there was an impressive 48 percent year-over-year increase in new swimming pool construction in the Austin area, resulting in more than 2,030 new permits on record with HBW.  Out of the four counties that make up the Austin area, Travis County held the greatest concentration of new pool construction activity, having approximately 1,545 permits on record with HBW for the 12-month period.

San Antonio

In San Antonio, there were more than 1,165 new swimming pool construction permits on record last year, reflecting a 19 percent year-over-year increase in new pool construction activity.  Out of the three counties that make up the San Antonio area, Bexar County held the greatest concentration of construction, having 855 new permits on record for the year.

To gain more information on the builders, homeowners and permits for the construction activity above, check out HBW for your copy of the latest construction data reports. To gain access to the HBW database and receive custom and detailed reports on the latest residential and commercial building activity in Florida, Georgia, Texas, Alabama, and Oklahoma, please contact HBW for details.

Texas Residential Construction Annual Review – 2022

A review of new residential construction data in Texas based on permits added to the HBW database during 2022

Upon review of HBW’s latest “Building Activity Trend Reports”, it appears that new residential construction has slowed in the Lone Star State over the last year.  From January through December 2022, there were approximately 87,710 new residential construction permits added to the HBW database for Texas, reflecting an 8 percent year-over-year decrease in new residential construction activity.  Out of the four major metropolitan areas reviewed, both Houston and Dallas carried the highest volume of housing starts, with more than 75 percent of all new residential construction permits in Texas originating from those areas. 

Here is a closer look at the total permits, annual percentage of growth, and leading counties for new residential construction across Texas last year:

Houston

Last year, Houston carried the greatest volume of new home construction (36,728 permits) in comparison to other Texas areas reviewed, having demonstrated an 11 percent year-over-year decrease in new residential construction activity. Out of the five counties that make up the Houston area, nearly half of all new home construction took place in Harris County, where there was approximately a 21 percent year-over-year decrease in new permits, resulting in 16,125 new permits on record with HBW.

Dallas

In Dallas, there were 30,167 new residential construction permits on record for 2022, reflecting a 5 percent year-over-year decrease in new home construction.  Out of the six counties that make up the Dallas area, the greatest concentration of new permits originated from the counties of Tarrant (8,812 permits) and Collin (8,025 permits) where there were year-over-year decreases in new home construction of 4 percent and 25 percent respectively.

Austin

Last year, there were 12,292 new residential construction permits recorded for the Austin area, reflecting a 6 percent year-over-year decrease in new home construction activity.  Out of the four counties included in the Austin-area report, Travis County carried just over half of all new residential construction activity, having 6,280 new residential permits (+5.5% YOY) on record with HBW for the one-year period.

San Antonio

Last year, there were 8,522 new residential construction permits in the San Antonio area, reflecting a 6 percent year-over-year decrease in new home construction.  Out of the three counties that make up the San Antonio area, more than half of all construction activity took place in Bexar County where there were 4,896 new permits, reflecting a 7 percent year-over-year increase in new residential construction.

To gain more information on the builders, homeowners and permits for the construction activity above, check out HBW for your copy of the latest construction data reports. To gain access to the HBW database and receive custom and detailed reports on the latest residential and commercial building activity in Florida, Georgia, Texas, Alabama, and Oklahoma, please contact HBW for details.