An HBW review of new swimming pool construction permits in Florida during the first quarter of 2019

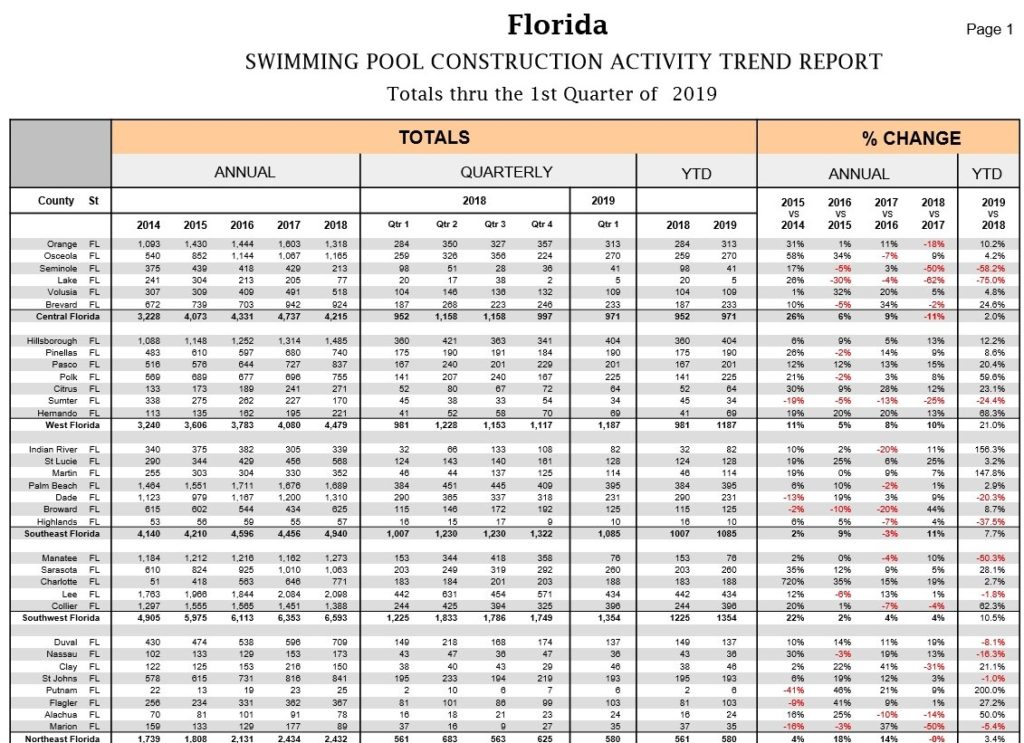
Over the last five years, Florida has exhibited year-over-year increases in new swimming pool construction every year. Since the start of this year (through March 2019), new swimming pool construction permits are already ahead of last year by 9 percent. Out of the six major Florida regions reviewed (Central, West, Southeast, Southwest, Northeast, Northwest), the greatest concentration of new permits could be found in the southwestern region (>1,350 permits), and the area that exhibited the highest rate of annual growth was West Florida (+21 percent).
Here is a brief overview of new permit data on file with HBW for the first quarter of this year:
Southwest Florida
Looking as far back as 2014, there has been a marked pattern of growth in new swimming pool construction in the southwest portion of the Sunshine State. In the first quarter of this year, there have been approximately 1,355 new swimming pool permits added to the HBW database for the area, reflecting more than a 10 percent increase in comparison to the same time last year. Southwest counties with the highest concentration of pool starts on file include Lee County (434 permits, -2 percent) and Collier County (396 permits, +62 percent).
West Florida
The western region of Florida ranked #2 for total new swimming pool permits on file with HBW in the first quarter of this year. With a 21% year-over-year increase (highest rate of growth in comparison to other regions), West Florida had just over 1,185 swimming pool permits on record for the first three months of this year. More than half of all new construction took place in two major counties: Hillsborough County (404 permits, +12 percent); Polk County (225 permits, +60%).
Southeast Florida
During Q1-2019, Southeast Florida experienced an 8 percent year-over-year increase in new pool construction, resulting in 1,085 swimming pool construction permits on file with HBW. More than half of all new construction permits originated from Palm Beach and Miami-Dade. With a 3 percent year-over-year increase in pool starts, Palm Beach County held the highest concentration of new pool permits (395 permits), and Miami-Dade ranked a distant second with more than 230 new permits on record for the three-month period.
Central Florida
While Central Florida experienced an annual dip of 11 percent in swimming pool construction last year, things are looking a little more optimistic at the start of 2019. In the first quarter of this year, the area reflects a 2 percent increase in new pool construction in comparison to the same time last year, resulting in just over 970 new permits. More than half of all new construction took place in the counties of Orange (313 permits, +10 percent) and Osceola (270 permits, +4 percent).
Northeast Florida
In the northeastern region of Florida, there were 580 swimming pool starts during Q1-2019, reflective of a 3 percent increase in comparison to the same period last year. The counties with the highest concentration of new swimming pool construction permits on file include: St. Johns (193 permits, -1 percent); Duval (137 permits, -8 percent); Flagler (103 permits, +27 percent).
Northwest Florida
While the northwest region carried the least amount of new swimming pool permits, it is still ahead of last year by more than 4%. From January through March of this year, there were nearly 520 swimming pool starts on file for the area. The counties with the highest concentration of new construction activity include Santa Rosa (108 permits, +10 percent) and Walton (99 permits, +11 percent).
To gain more information on the builders, homeowners and permits for the construction activity above, check out HBW for your copy of the latest construction data reports. To gain access to the HBW database and receive custom and detailed reports on the latest residential and commercial building activity in Florida, Georgia, Texas, Alabama, and Oklahoma, please contact HBW for details.
