
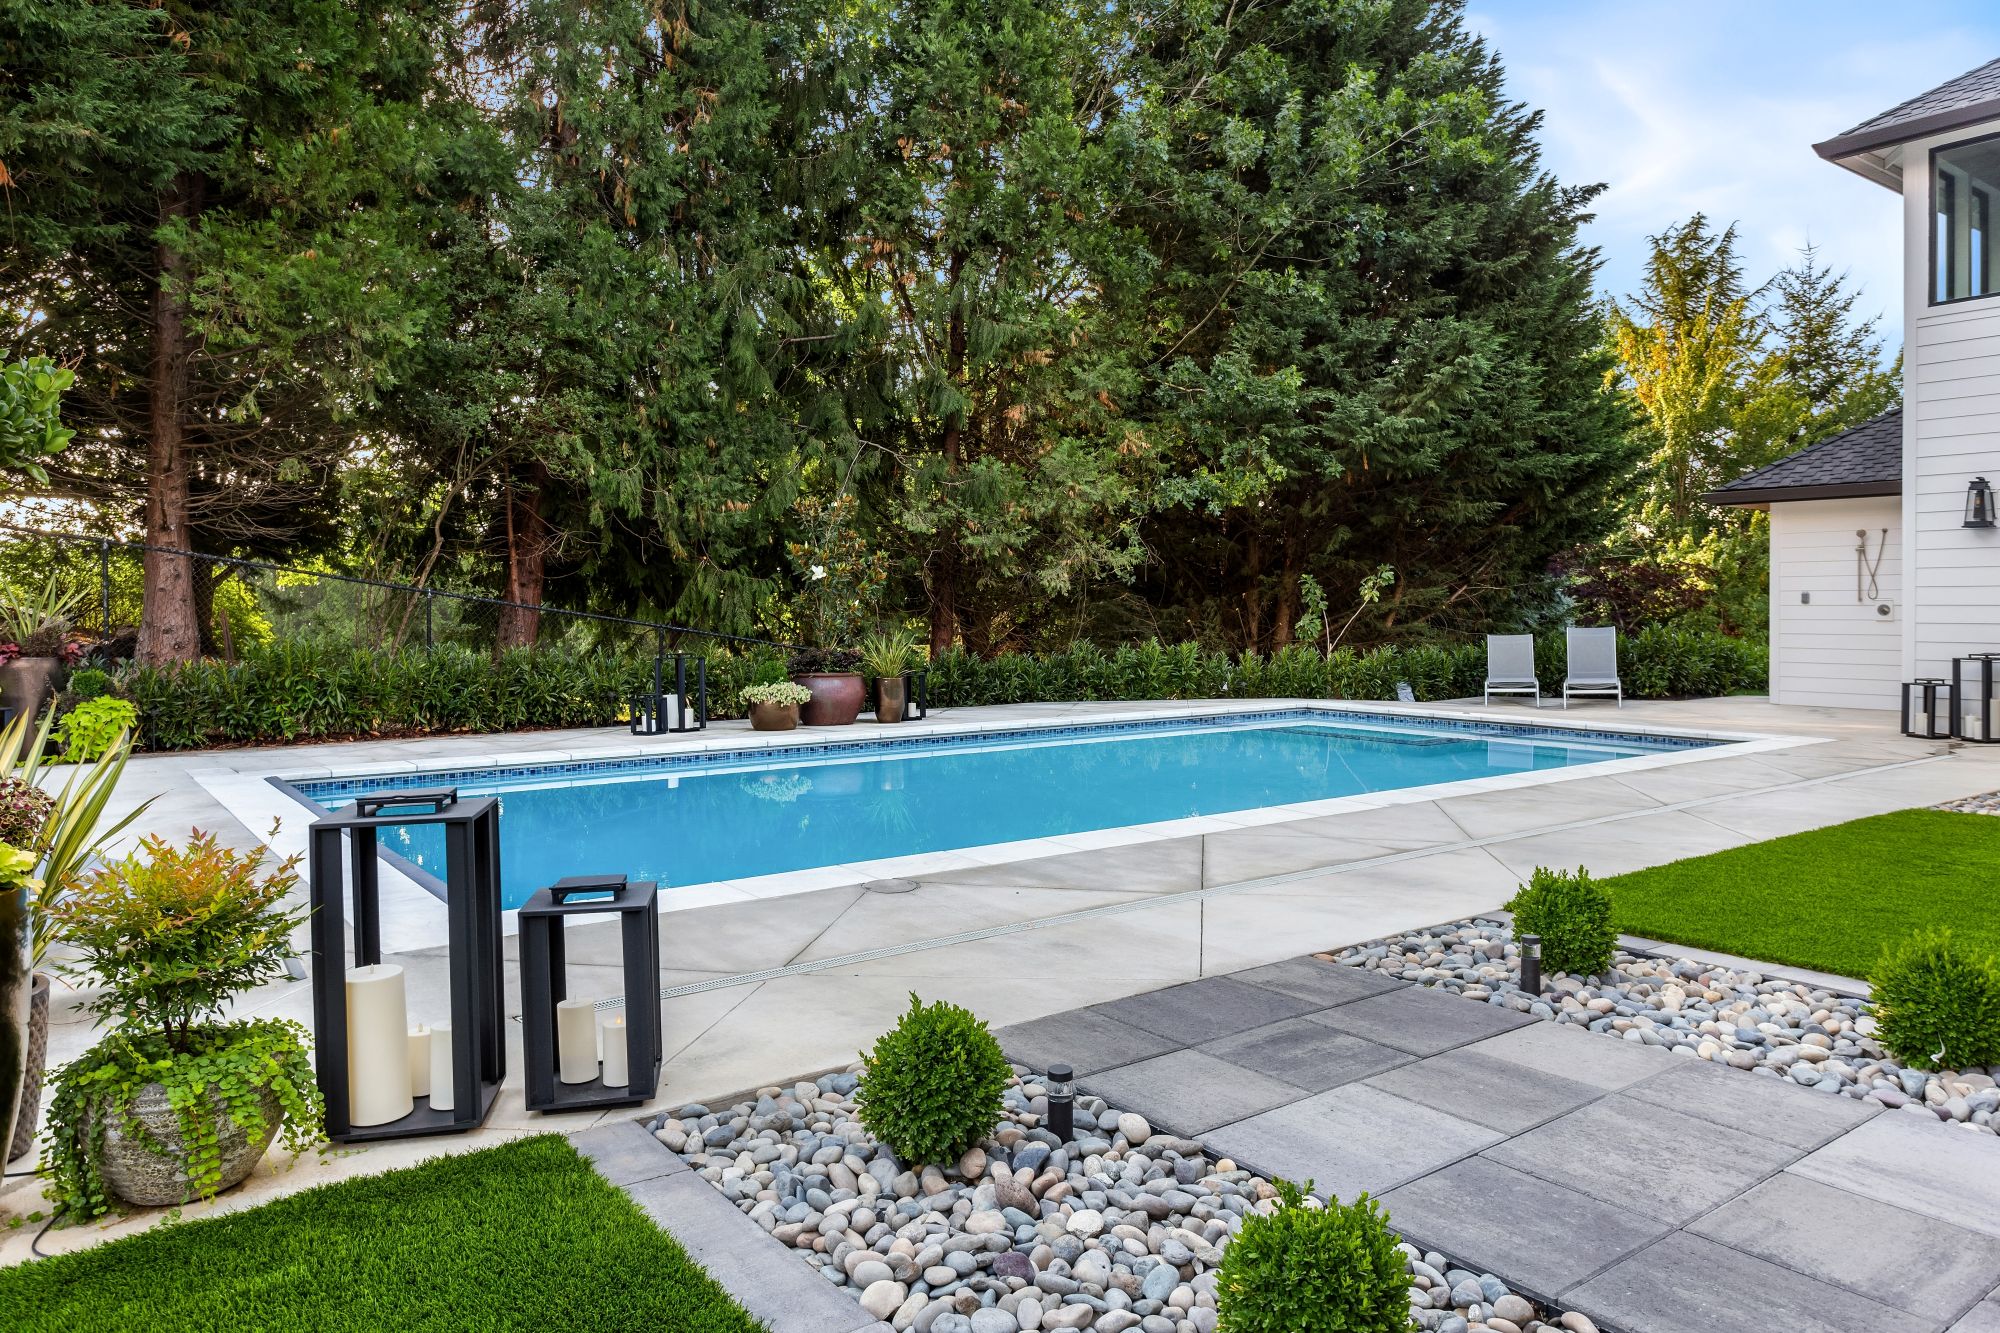
August in Texas is traditionally a month defined by two things: heat that could fry an egg, and homeowners who suddenly realize that a swimming pool isn’t a luxury—it’s survival equipment. Fortunately for the construction industry, that seasonal urgency translated into a surge of new pool construction permits across the state’s major metro areas.
According to the latest HBW construction data, 584 new swimming pool permits were added to the database in August 2026, representing more than $42.3 million in total construction value. That’s a 31% month‑over‑month increase, a jump that is worth noting, even if just a monthly change.
Earlier this week, we used HBW reports to highlight the top pool builders that were driving new construction in the Lone Star State last month, and today, we are using the same reports to take a closer look at where those permits were pulled, how values compare across regions, and which counties are driving the market. For construction professionals, this is the type of data that keeps your finger firmly on the pulse of the residential pool sector in Texas.
Statewide Snapshot
- Total Permits: 584
- Total Construction Value: $42.3M+
- Month‑over‑Month Growth: 31%
- Major Metros Included: Dallas, Houston, Austin, San Antonio
Dallas
Total Permits: 241 Total Value: $19,011,830 Average Value: $78,887
Dallas led the state in total permit volume, accounting for approximately 41% of all new pool permits statewide—a commanding share that underscores the region’s strong residential development activity. Out of the various counties that make up the Dallas area, the following ranked as the top five for total new permits:
- Tarrant County: 87 permits | Total Value: $8,821,232
- Denton County: 43 permits | Total Value: $3,444,034
- Collin County: 51 permits | Total Value: $3,438,900
Tarrant County alone represents 36% of Dallas‑area permits, making it the epicenter of North Texas pool construction for the month. Denton and Collin follow with nearly identical total values, though Collin edges out Denton slightly in permit count. The average construction value in Dallas (nearly $79K) places it among the higher‑value markets statewide. The distribution of permits across three major counties also reflects the region’s ongoing suburban expansion—where backyard pools are practically a standard feature.
Houston
Total Permits: 177 Total Value: $14,010,404 Average Value: $79,155
Houston came in second in total permit volume, representing approximately 30% of statewide activity. And while Dallas had the highest count, Houston actually posted the highest average value of all four metros—just edging Dallas by a few hundred dollars. From a county perspective, there were a couple (mostly Harris) that carried the majority of new construction:
- Harris County: 130 permits | Total Value: $9,737,404
- Galveston County: 20 permits | Total Value: $2,007,000
Harris County captured a massive 73% of all Houston‑area permits, making it the undisputed heavyweight of pool construction in area. Galveston, while a distant second, still posted a respectable $2M in value—proof that coastal homeowners enjoy more than just ocean views. The high average value in Houston suggests larger or more feature‑rich pool projects—think integrated spas, water features, and maybe a tanning ledge or two. The concentration in Harris County also reflects dense urban and suburban demand.
Austin
Total Permits: 113 Total Value: $6,072,732 Average Value: $53,741
Austin accounted for just over 19% of statewide permits, but its average value was the lowest of all four metros. This isn’t necessarily a sign of smaller pools—it may reflect more modest designs or tighter lot configurations in urban infill areas. When looking at the counties where construction was taking place, there was a singular standout:
- Travis County: 98 permits | Total Value: $5,219,600
A remarkable 87% of all Austin‑area permits were pulled in Travis County. In other words, Austin’s pool market is essentially Austin—with surrounding counties contributing minimally this month. The area’s lower average value may indicate a trend toward compact, modern pools—clean lines, plunge designs, and efficient footprints that suit the city’s architectural preferences.
San Antonio
Total Permits: 53 Total Value: $3,214,200 Average Value: $60,645
San Antonio represented 9% of statewide activity, making it the smallest of the four markets in August. However, its average value sits comfortably above Austin’s, suggesting mid‑range pool projects with solid feature sets. From a county perspective, the bulk of all new construction took place in two counties:
- Bexar County: 35 permits | Total Value: $2,349,800
- Guadalupe County: 14 permits | Total Value: $724,400
Bexar County accounted for 66% of San Antonio‑area permits, with Guadalupe contributing a smaller but still meaningful share. Overall, San Antonio’s pool market remains steady but modest, and actually reflects some growth with a month-over-month increase. Growth in the area tends to follow new‑home development corridors, particularly in Bexar and Guadalupe.
Regional Comparisons & Key Takeaways
When comparing the four major metro areas, Dallas clearly stands out as the powerhouse of new swimming pool construction for August 2026. With 241 permits, it accounted for roughly forty‑one percent of all new pool activity statewide, reinforcing its role as the state’s most active and broadly distributed market. Houston followed as a strong second, contributing thirty percent of total permits and distinguishing itself with the highest average project value of the month. Its slightly higher price point suggests a trend toward larger or more feature‑rich pool builds, particularly concentrated in Harris County, which alone produced more permits than any other county in Texas.
Austin, while responsible for nineteen percent of statewide permits, demonstrated a very different profile. Its average value was the lowest among the four metros, hinting at smaller, design‑forward projects or more compact lot conditions that naturally limit pool size. Nearly all of Austin’s activity was concentrated in Travis County, making it the most centralized market in the state. San Antonio, meanwhile, represented the smallest share of new pool construction at nine percent. Even so, its average value landed comfortably above Austin’s, suggesting a steady mid‑range market driven primarily by Bexar County, with Guadalupe County contributing a modest but meaningful portion of the monthly activity.
Overall, last month proved to be a strong month for new swimming pool construction across Texas, with a thirty‑one percent month-over-month increase in permits that signals both heightened seasonal demand and broader market momentum. Dallas dominated in sheer volume, Houston led in project value, Austin leaned into compact and modern designs, and San Antonio maintained a somewhat steady and predictable pace. Together, the regional dynamics paint a clear picture of a market that is both active and evolving, shaped by local development patterns, homeowner preferences, and the ever‑present Texas heat that keeps demand reliably high.
To gain more information on the builders, homeowners and permits for the construction activity above, check out HBW for your copy of the latest construction data reports. To gain access to the HBW database and receive custom and detailed reports on the latest residential and commercial building activity in Florida, Georgia, Texas, Alabama, and Oklahoma, please contact HBW for details.