
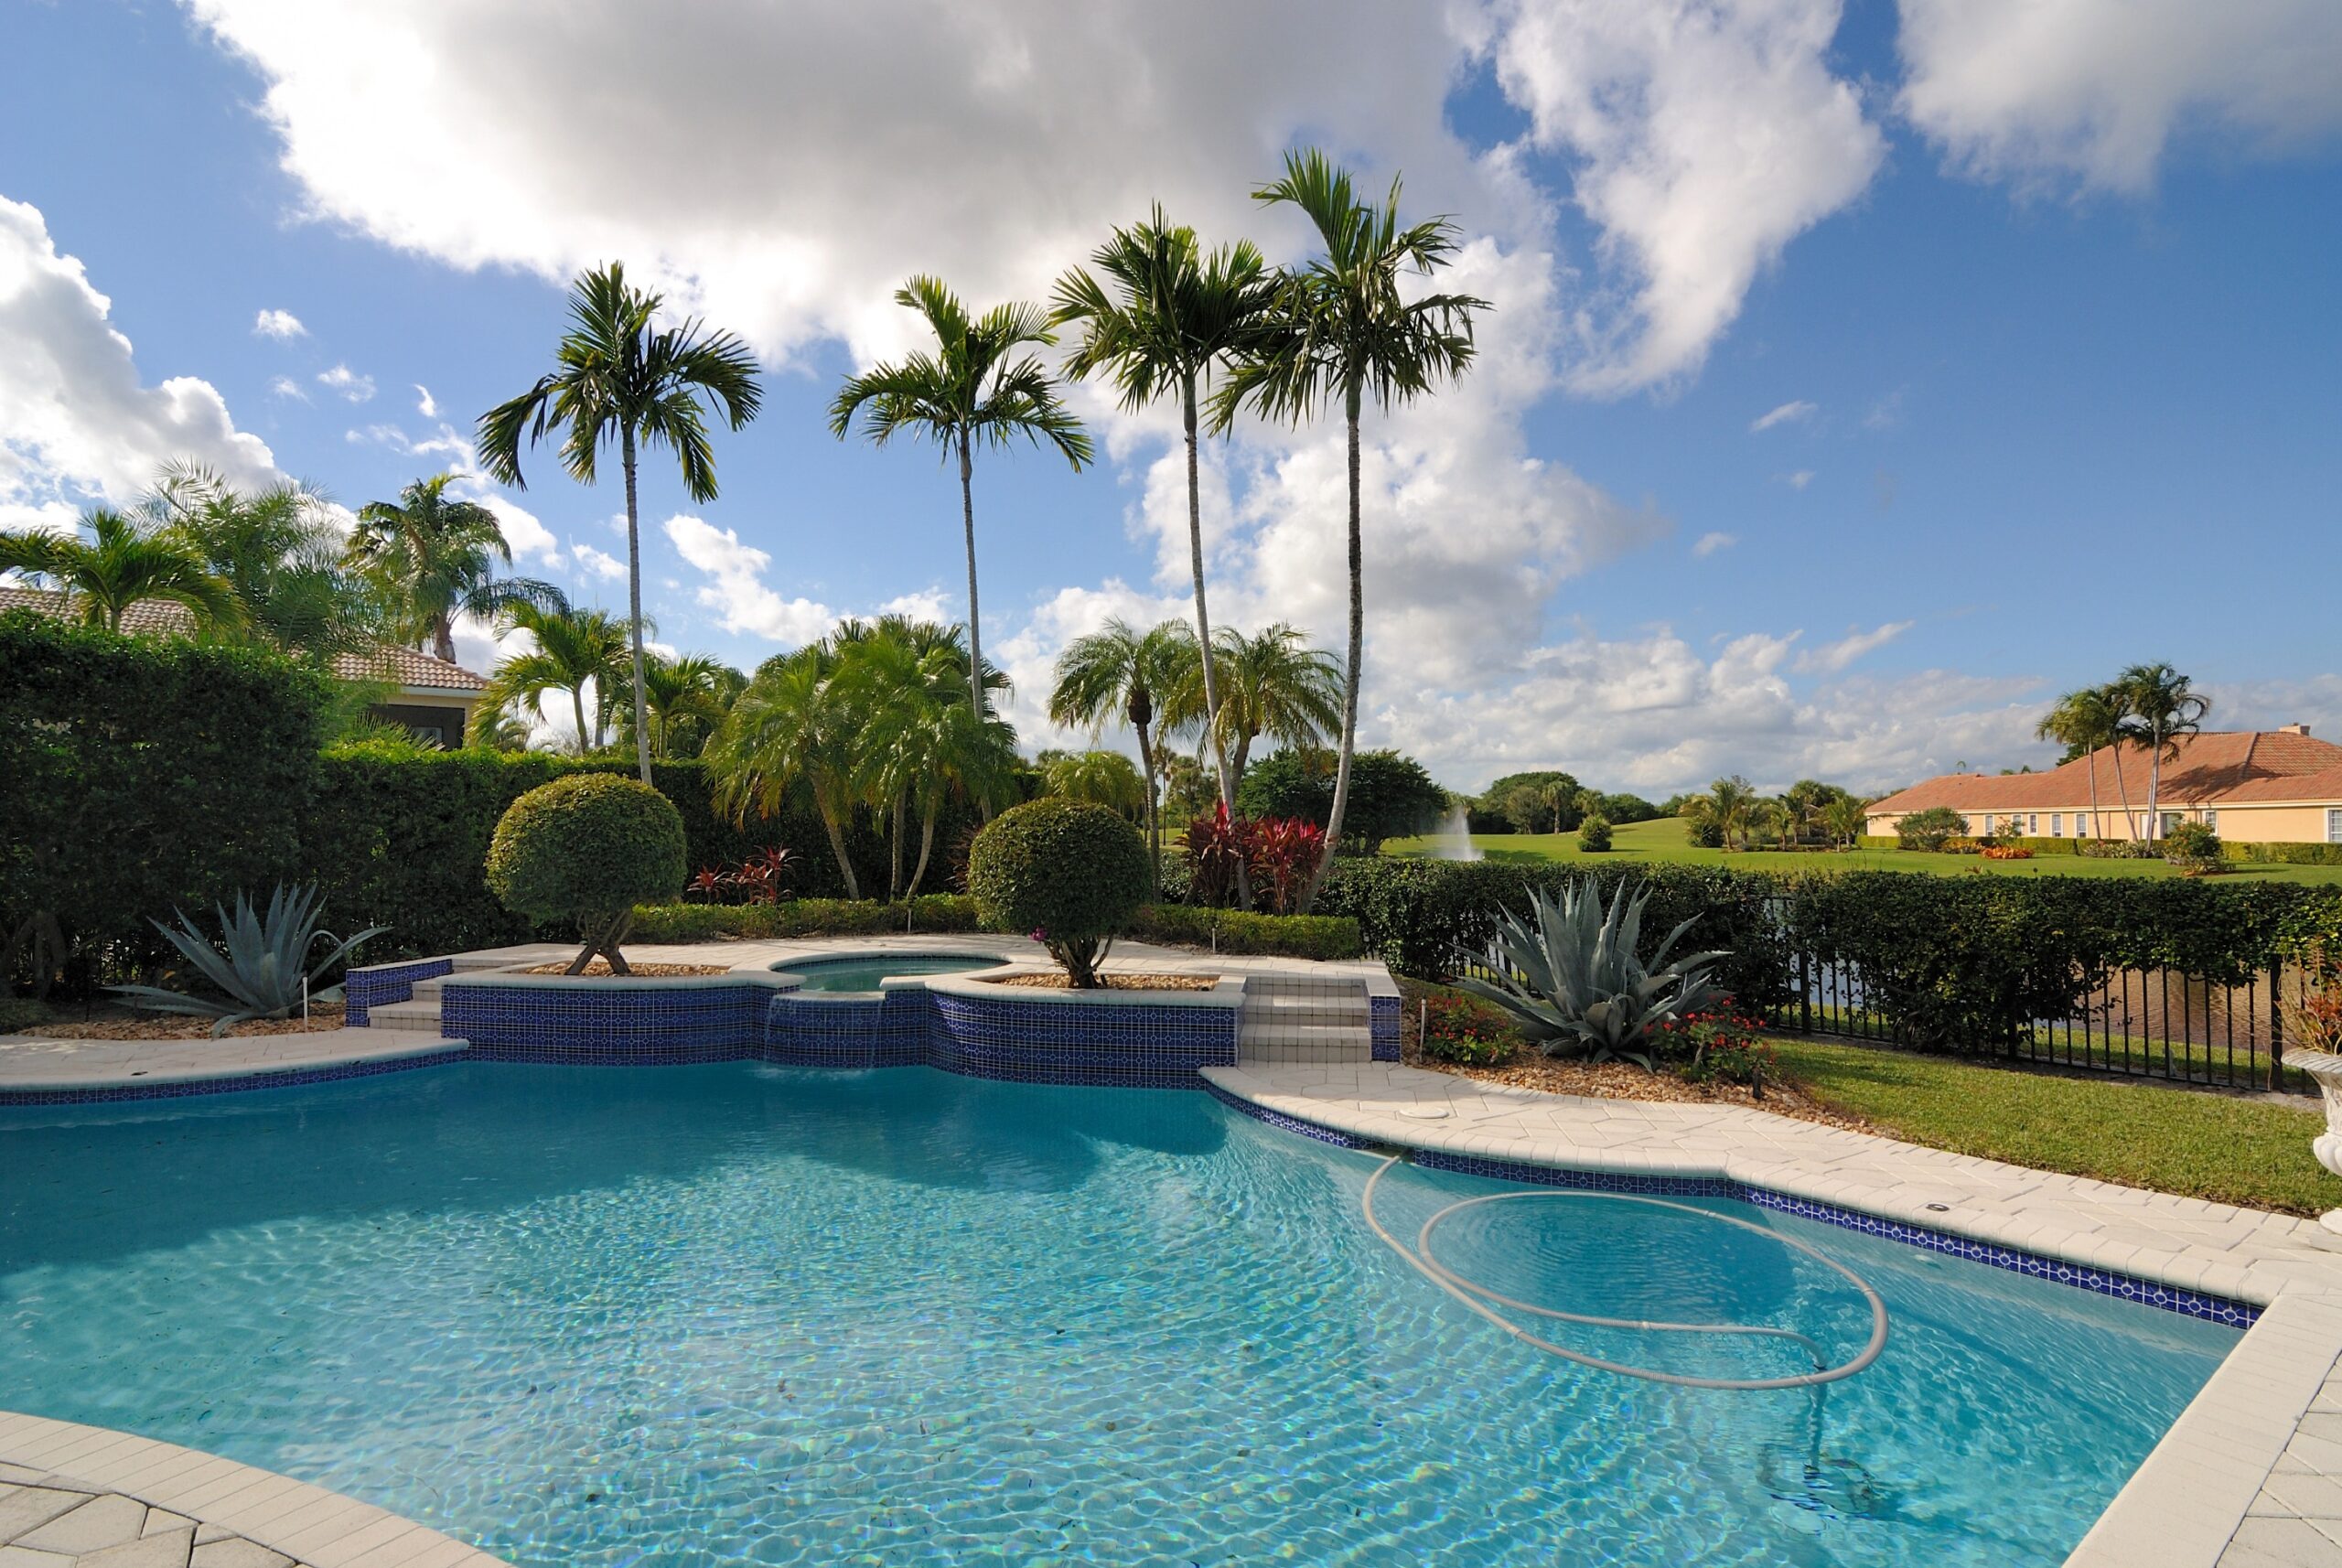
Florida has never been shy about its affinity for swimming pools; they are as Floridian as afternoon thunderstorms, key lime pie, and sandy beaches. But lifestyle and leisure aside, pool construction is also a reliable barometer of residential investment, consumer confidence, and regional development trends across the state.
According to the latest HBW Swimming Pool Construction Activity Trend Report, there were 15,008 new swimming pool construction permits added to the HBW database for Florida through the second quarter of 2026; this figure represents a 4% year‑to‑date increase, perfectly mirroring the growth rate observed in 2025. In other words, the market is consistent, steady, and showing no signs of fatigue.
Below is a region‑by‑region overview of where the strongest activity is occurring, which counties are driving growth, and what these patterns may suggest about Florida’s construction landscape heading into the second half of the year.
Southwest Florida
If Florida’s pool construction market were a competitive sport, Southwest Florida would currently be the team to beat. With 4,798 new permits on record through Q2, the region is posting a 13% year‑to‑date increase, the highest growth rate of all six regions reviewed, and two counties are doing the heavy lifting so far this year:
- Lee County: 1,395 permits, reflecting a 15% year-to-date increase (vs. Q2 2025). Lee continues to be a magnet for residential development, and its pool construction activity reinforces the region’s strong demand for outdoor amenities.
- Manatee County: 1,008 permits, with a remarkable 40% year‑to‑date increase. Manatee’s surge suggests a combination of population inflow, new housing starts, and a consumer base eager to invest in home upgrades.
This region’s performance points to a market operating with notable strength, propelled by a mix of ongoing residential development and a rising number of high‑value home improvement projects.
West Florida
West Florida and Southeast Florida both posted 2,641 permits through Q2, but the similarity ends there. West Florida is experiencing a 3% year‑to‑date increase, while Southeast Florida is seeing a 10% decline.
Within West Florida’s seven‑county region, two counties account for approximately half of all new pool construction:
- Hillsborough County: 773 permits, with a 10% YTD increase. Hillsborough’s steady growth reflects a balanced mix of urban development and suburban expansion.
- Sumter County: 555 permits, boasting a 40% YTD increase—another standout performance. Sumter’s surge is likely closely tied to ongoing residential growth patterns, particularly in master‑planned communities.
West Florida’s numbers suggest a region that is strengthening, driven by stable demand and strategic residential development.
Southeast Florida
Southeast Florida (2,641 permits) remains one of the state’s most active markets, but the region is experiencing a 10% year‑to‑date decrease. Even so, its permit volume remains substantial, and two counties continue to dominate activity:
- Palm Beach County: 904 permits, reflecting a 17% decrease. While still a high‑volume market, Palm Beach’s slowdown may indicate a shift toward renovation over new construction or simply a continued cooling period after elevated activity in 2024, and a slowing down last year.
- Miami‑Dade County: 729 permits, with a 7% decrease. Miami‑Dade’s decline is modest, and given the county’s density and development patterns, fluctuations are not unusual.
Southeast Florida’s dip doesn’t signal distress at this point; rather, it suggests a recalibration after last year’s strong growth.
Central Florida
Central Florida recorded 1,893 permits through Q2, reflecting a 1% year‑to‑date decrease. Compared to last year’s 4% decline, the market appears to be stabilizing.
Two counties are leading the region:
- Orange County: 549 permits, with a 2% increase. Orange County’s modest growth aligns with its steady residential expansion and strong consumer demand.
- Lake County: 443 permits, posting an 11% increase. Lake County continues to benefit from suburban growth and new housing development.
Central Florida’s market is neither booming nor shrinking—it’s leveling, which is often a sign of long‑term sustainability.
Northeast Florida
Northeast Florida added 1,584 permits through Q2, marking a 10% year‑to‑date increase. The region’s growth is distributed across several counties, with three standing out:
- St. Johns County: 558 permits, with a 0% change year‑over‑year. St. Johns is holding steady—literally to the permit—reflecting a mature market with consistent demand.
- Marion County: 272 permits, demonstrating a 31% year-to-date increase. Marion’s surge suggests expanding residential development and increased consumer investment.
- Duval County: 269 permits, with a 15% increase. Duval’s growth aligns with broader development trends in the Jacksonville metro area.
Northeast Florida’s performance reflects a healthy mix of stability and expansion.
Northwest Florida
Northwest Florida recorded 1,451 permits, reflecting a 3% year‑to‑date increase. The region’s activity is spread across 18 counties, including two that border Alabama. When it comes to higher concentrations of new permits, there are several counties that stand out:
- Bay County: 250 permits, with a 2% year-to-date decrease. Bay’s slight decline is modest and may reflect temporary market fluctuations.
- Santa Rosa County: 248 permits, posting a 12% year-to-date increase. Santa Rosa continues to grow steadily, supported by ongoing residential development.
- Walton County: 246 permits, reflecting a 5% year-to-date decrease. Walton’s dip is small and not necessarily indicative of a broader trend.
- Baldwin County, Alabama: 291 permits, exhibiting a 22% year-to- date increase. Although outside of Florida, Baldwin’s inclusion in the report highlights its strong influence on regional construction patterns.
The market in Northwest Florida is stable, with pockets of strong growth and minor declines that balance each other out.
Statewide Outlook
Florida’s swimming pool construction market through the second quarter of 2026 reflects a steady statewide growth rate of 4 percent, supported by strong regional leaders in Southwest and West Florida, both of which continue to outperform other areas in overall permit volume and year‑to‑date expansion. The noted momentum is further amplified by pronounced localized surges in counties such as Manatee, Sumter, Marion, and Baldwin, where construction activity has accelerated well beyond regional averages. At the same time, several mature markets—including Palm Beach, Miami‑Dade, and Walton—are experiencing moderate declines as demand has cooled in the first half of the year. Central Florida, which had previously shown patterns of slowing, now appears to be stabilizing, with permit totals leveling off and signaling a more balanced and sustainable pace of development across the region.
If the current statewide trajectory holds, 2026 may close out with another year of healthy growth—perhaps not explosive, but certainly resilient. And in a state where sunshine is abundant and backyard pools are practically cultural currency, that resilience is both expected and welcome.
To gain more information on the builders, homeowners and permits for the construction activity above, check out HBW for your copy of the latest construction data reports. To gain access to the HBW database and receive custom and detailed reports on the latest residential and commercial building activity in Florida, Georgia, Texas, Alabama, and Oklahoma, please contact HBW for details.