
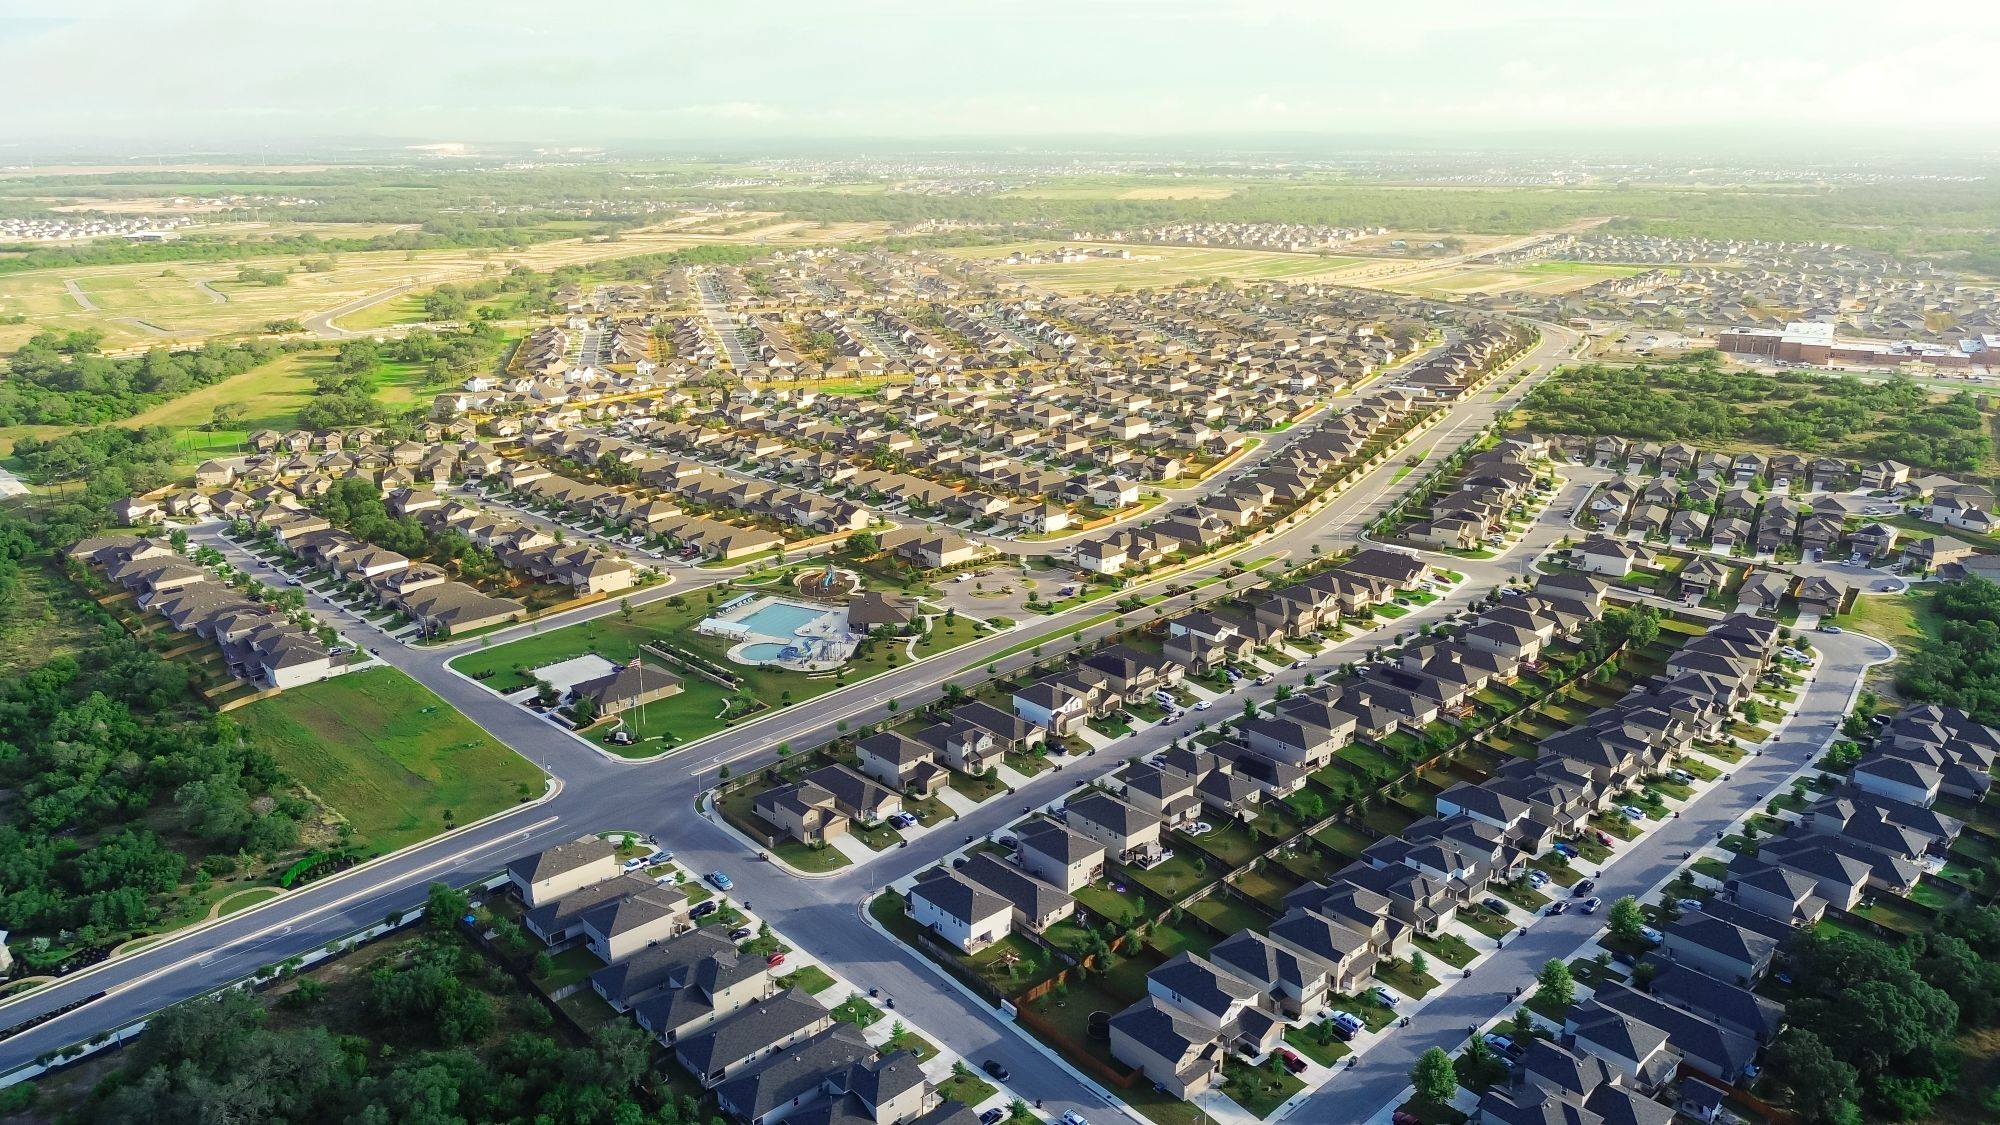
As reported earlier this week on the HBW blog, Texas home construction in May 2026 was anything but sleepy. According to the latest HBW residential construction data, more than 5,950 new residential construction permits were added across the four major metros of Houston, Dallas, Austin, and San Antonio, representing over $1.9 billion in total construction value. Today, we will be using the same construction data reports from HBW to drill a bit deeper — county by county, permit by permit — to understand where the growth is concentrated, how values compare, and what construction professionals should be paying attention to as they plan their next moves.
Across the four major metros the new residential construction permit count was as follows:
- Total permits: 5,952
- Total construction value: $1.92B+
- Average value (combined): ~$323K
But the real story is in the regional differences — and Texas rarely disappoints when it comes to regional personality. Here is a look at what was happening on a regional level last month:
Houston: The Permit Powerhouse
Houston once again leads the state in sheer volume, pulling 2,637 permits — approximately 44% of all new Texas residential permits for the month.
Key Stats
- Total Permits: 2,637
- Total Value: $816,294,246
- Average Value: $309,554
County Concentrations
- Harris County: 957 permits | $331,392,339 in value | Represents 36% of all Houston-area permits
- Montgomery County: 802 permits | $208,287,937 in value | Represents more than 30% of Houston-area permits
Houston continues to be the gravitational center of Texas homebuilding. Harris and Montgomery alone account for two-thirds of the metro’s activity. The average value sits slightly below the statewide average, reflecting Houston’s continued dominance in volume-driven, mid-range residential construction.
Dallas: High Value, High Velocity
Dallas pulled 2,028 permits, securing the second-highest volume statewide — about 34% of all Texas permits.
Key Stats
- Total Permits: 2,028
- Total Value: $694,539,774
- Average Value: $342,475
County Concentrations
- Tarrant County: 784 permits | $279,518,825 in value | 39% of Dallas-area permits
- Collin County: 595 permits | $187,870,427 in value | 29% of Dallas-area permits
Dallas continues to flex its higher-value market profile. With an average construction value of $342K, it outpaces Houston and San Antonio and comes close to Austin’s premium pricing.
Austin: Fewer Permits, Premium Pricing
Austin issued 802 permits, but what it lacks in volume, it makes up for in value.
Key Stats
- Total Permits: 802
- Total Value: $277,289,763
- Average Value: $345,748 (highest among all metros)
County Concentrations
- Travis County: 389 permits | $129,956,263 in value | 48% of Austin-area permits
- Williamson County: 287 permits | $106,588,500 in value | 36% of Austin-area permits
Austin continues to be the luxury sibling of the Texas metros. With the highest average value statewide, the region remains a magnet for higher-end residential construction.
San Antonio: Steady, Strong, and Value-Conscious
San Antonio rounds out the list with 485 permits, representing about 8% of statewide activity.
Key Stats
- Total Permits: 485
- Total Value: $133,041,880
- Average Value: $274,313 (lowest among the four metros)
County Concentration
- Bexar County: 300 permits | $83,648,980 in value | 62% of San Antonio-area permits
San Antonio remains the most value-conscious market, with the lowest average construction value. But don’t mistake “value-conscious” for “slow.” The metro continues to show consistent, stable growth — the kind that keeps trades busy and supply houses humming.
Statewide Insights & Takeaways
1. Houston dominates in volume — nearly half of all Texas permits – If you are a supplier, subcontractor, or service provider, Houston is the market where your phone is most likely to ring.
2. Austin leads in average value – High-end builds, custom homes, and premium materials continue to define the region.
3. Dallas strikes the balance between volume and value – A strong mix of mid- and upper-tier construction makes Dallas a strategic market for diversified builders.
4. San Antonio remains the most affordable market – Lower average values make it attractive for first-time buyers and production builders.
5. County-level concentration is evident – Across all metros, a small number of counties account for the majority of activity. This is gold for business development — fewer counties to target, more opportunities per square mile.
What This Means for Construction Professionals
You might consider shaping your next quarter’s strategy around the counties showing the strongest momentum—places like Harris, Montgomery, Tarrant, Travis, and Bexar, which currently appear to be carrying much of the month’s activity. It may also be worthwhile to keep an eye on how pricing trends shift by metro, since Austin and Dallas continue to support higher-value construction while Houston and San Antonio lean toward more mid‑range projects. And because monthly permit data often serves as an early indicator of what’s coming down the pipeline, treating these numbers as a kind of forward-looking radar could help you anticipate where demand may surface next, giving you a head start on positioning your services and outreach accordingly. In other words, HBW’s data for May isn’t just a snapshot. It’s a roadmap.
And in Texas, that roadmap is wide open, well-paved, and — based on these numbers — getting new subdivisions added every week.
To gain more information on the builders, homeowners and permits for the construction activity above, check out HBW for your copy of the latest construction data reports. To gain access to the HBW database and receive custom and detailed reports on the latest residential and commercial building activity in Florida, Georgia, Texas, Alabama, and Oklahoma, please contact HBW for details.