
An HBW review of new swimming pool construction permits in Florida from January thru December 2018
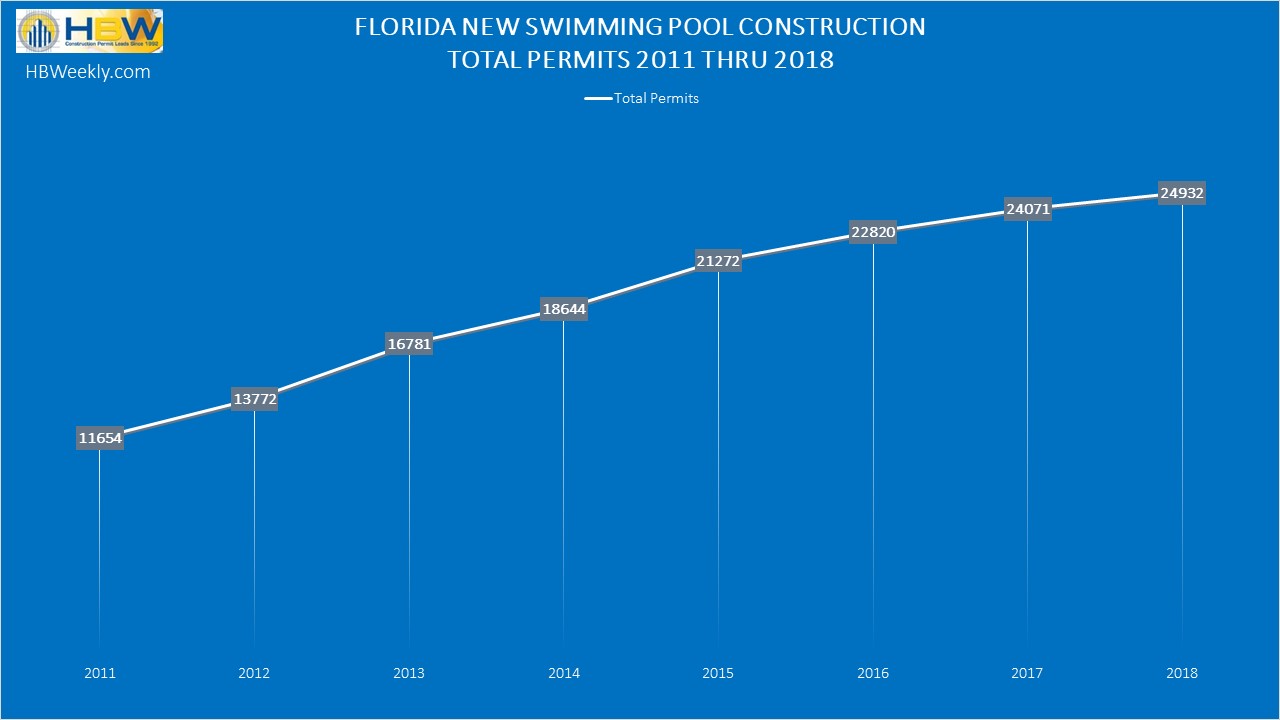
FL Swimming Pool Permits 2011-2018
New swimming pool construction continues to rise annually in the Sunshine State. Since 2013, new pool construction has been producing more permits in the HBW database every year, and in 2018 Florida experienced a 4% year-over-year increase in swimming pool starts, resulting in nearly 25,000 new permits on file with HBW.
Out of the six major regions reviewed (Central, West, Southeast, Southwest, Northeast, Northwest), the southwestern region held the greatest amount of new pool construction activity. With a 4% year-over-year increase in new permits, there were nearly 6,600 swimming pool starts in Southwest Florida last year. Southwest counties that held the highest concentration of new permits include Lee (2,098 permits), Collier (1,388 permits) and Manatee (1,273). When looking at the greatest annual spikes of new construction in the area, Charlotte County was a standout having exhibited a 19% year-over-year increase in swimming pool starts.
The area that ranked second-highest for total new pool permits is Southeast Florida. The southeast has officially climbed out of the minor dip in swimming pool construction it experienced in 2017 to having rebounded with a 10% year-over-year increase in 2018. Out of the 4,940 new pool permits in the southeast, more than half originated from Miami (1,310 permits) and Palm Beach (1,689).
Another area that experienced a 10% year-over-year increase in new pool construction was West Florida. In the west, there were approximately 4,480 pool starts last year. Hillsborough County led over all others for new construction having exhibited a 13% year-over-year increase in new pool construction that resulted in 1,485 new permits. The western county that experienced the highest level of growth in new pool construction is Pasco County. In Pasco, pool construction has been on the rise since 2013, and last year the area exhibited a 15% year-over-year increase in pool starts, resulting in 837 permits for the year.
When moving our focus to the northwest, we found the greatest increase in new pool construction. Since 2013, swimming pool construction has been greatly increasing on an annual basis in the northwestern region of Florida, and last year was no exception. In 2018, the northwest demonstrated a 13% year-over-year increase in new pool construction, resulting in 2,273 total permits for the year.
Areas that were either on par with the previous year or fell just below on new pool construction included Central and Northeast Florida. After a five-year growth pattern in Central Florida, last year swimming pool construction experienced a year-over-year decline of 7%, resulting in 4,215 total permits; that being stated, the central County of Osceola did not reflect the area’s pattern as it exhibited a 9% year-over-year increase in new pool construction, resulting in 1,165 new permits. In the northeastern region, new pool construction appears to have held steady and leveled off in 2018 as there were just over 2,432 new permits added to the HBW database – approximately the same amount as 2017. The bulk of new pool construction in the northeast took place in the counties of St. Johns (841 permits, +3%) and Duval (709 permits, +19%).
To gain more information on the builders, homeowners and permits for the construction activity above, check out HBW for your copy of the latest construction data reports. To gain access to the HBW database and receive custom and detailed reports on the latest residential and commercial building activity in Florida, Georgia, Texas, Alabama, and Oklahoma, please contact HBW for details.