
An overview of Florida permit data for new home construction in 2019
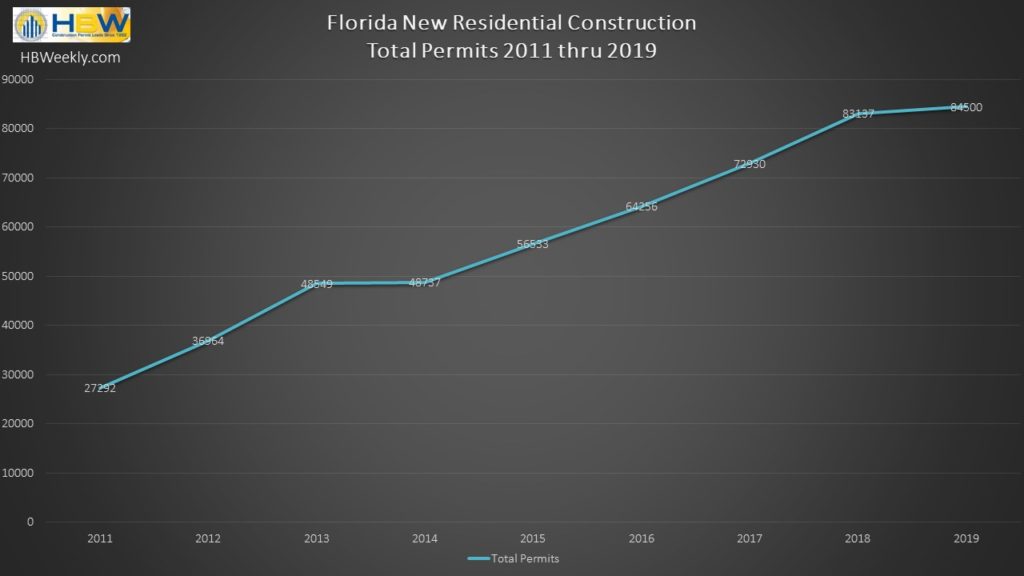
Residential construction has been booming in Florida for years. According to HBW records, the market has been on an upward trajectory since 2011, reflecting annual increases as high as 16 percent or more. While the residential construction industry is still growing in the Sunshine State, last year showed signs of slowing in the rate of growth. From January 1st to December 31, 2019, there was a 2 percent year-over-year increase in new home construction in Florida, resulting in 84,500 new permits on record with HBW.
Out of the six major regions reviewed (Northwest, Northeast, Southwest, Southeast, West, Central), the two areas that exhibited growth in residential construction were the northwestern and western portions of the state with year-over-year increases of 7 percent and 16 percent respectively. The areas with the highest concentration of new permits on record for the one-year period include West Florida (20,110 permits) and Southwest Florida (15,738 permits).
Here is a breakdown of the total residential construction permits, annual comparisons and leading counties by Florida region in 2019:
West Florida
Total permits: 20,110
% change in total permits (in comparison to 2018): +16 percent
Top county for total permits: Hillsborough (5,945 permits)
Percentage of Permits representing “high value” (>$500k) properties: 5 percent
Southwest Florida
Total permits: 15,738
% change in total permits (in comparison to 2018): N/A
Top county for total permits: Lee County (4,668 permits)
Percentage of Permits representing “high value” (>$500k) properties: 4 percent
Northeast Florida
Total permits: 13,872
% change in total permits (in comparison to 2018): -5 percent
Top county for total permits: Duval County (4,155 permits)
Percentage of Permits representing “high value” (>$500k) properties: 3 percent
Central Florida
Total permits: 13,866
% change in total permits (in comparison to 2018): -8 percent
Top county for total permits: Orange County (4,988 permits)
Percentage of Permits representing “high value” (>$500k) properties: 8 percent
Northwest Florida
Total permits: 11,086
% change in total permits (in comparison to 2018): 7 percent
Top county for total permits: Santa Rosa (1,551 permits)
Percentage of Permits representing “high value” (>$500k) properties: 5 percent
Southeast Florida
Total permits: 9,828
% change in total permits (in comparison to 2018): -1 percent
Top county for total permits: St. Lucie (3,451 permits)
Percentage of Permits representing “high value” (>$500k) properties: ~10 percent
To gain more information on the builders, homeowners and permits for the construction activity above, check out HBW for your copy of the latest construction data reports. To gain access to the HBW database and receive custom and detailed reports on the latest residential and commercial building activity in Florida, Georgia, Texas, Alabama, and Oklahoma, please contact HBW for details.