
HBW Florida Swimming Pool Construction Report – January 2017
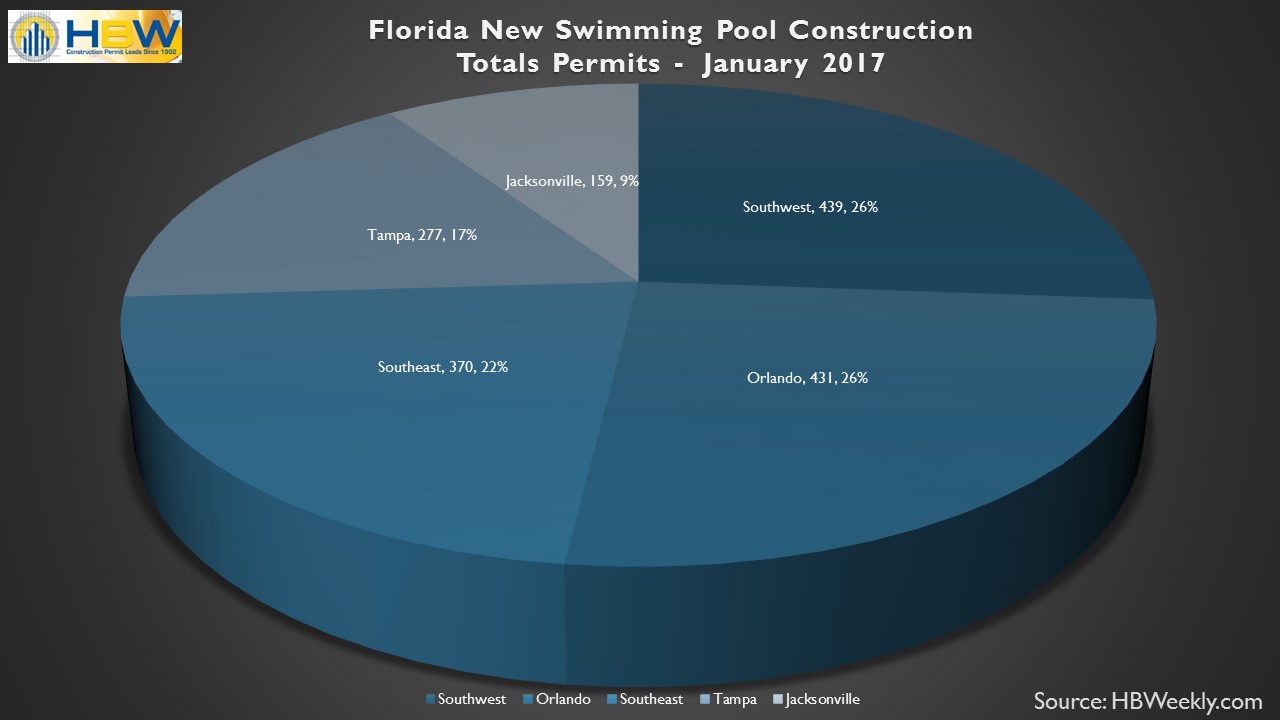
FL Pool Permits by Area – Jan. 2017
In Florida, there is no shortage of swimming pools, and when it comes to new pool construction, Orlando was in the spotlight last month. Out of the more than 1,675 swimming pool starts and approximately $73M in construction value on file with HBW for the month, Orlando was the only area that experienced an increase in new swimming pool construction since December. With a 45% month-over-month increase in swimming pool starts, there were more than 430 new permits and approximately $18M in total construction value in Orlando during the month of January. Out of the nearly 80 active builders in the area during the one-month period, All Seasons continued to hold its ranking in the top spot for total permits with 61 pool starts at an average value close to $39k.
Just ahead of Orlando was the southwest region of Florida as there were nearly 440 swimming pool starts and approximately $20M in construction value last month. Month after month, the southwest region has remained a leader for new pool construction, and in January, more than half of all pool starts took place in the counties of Lee and Collier. Out of the 112 active builders with new permits on file for the month, Aragon Pools and Spas maintained its lead at the top of the charts with 36 pool starts having an average value just over $40k.
Down one spot since December, the southeast region of Florida had 370 swimming pool starts with close to $17M in construction value last month. The bulk of new construction was concentrated in the areas of Palm Beach and Miami. New construction was widespread and shared by nearly 140 active builders over the one-month period, with A&G Concrete Pools remaining in the #1 spot for total starts. With 24 new pool permits at an average value just over $43k, A&G Concrete Pools was mostly active in the counties of Indian, St. Lucie and Martin.
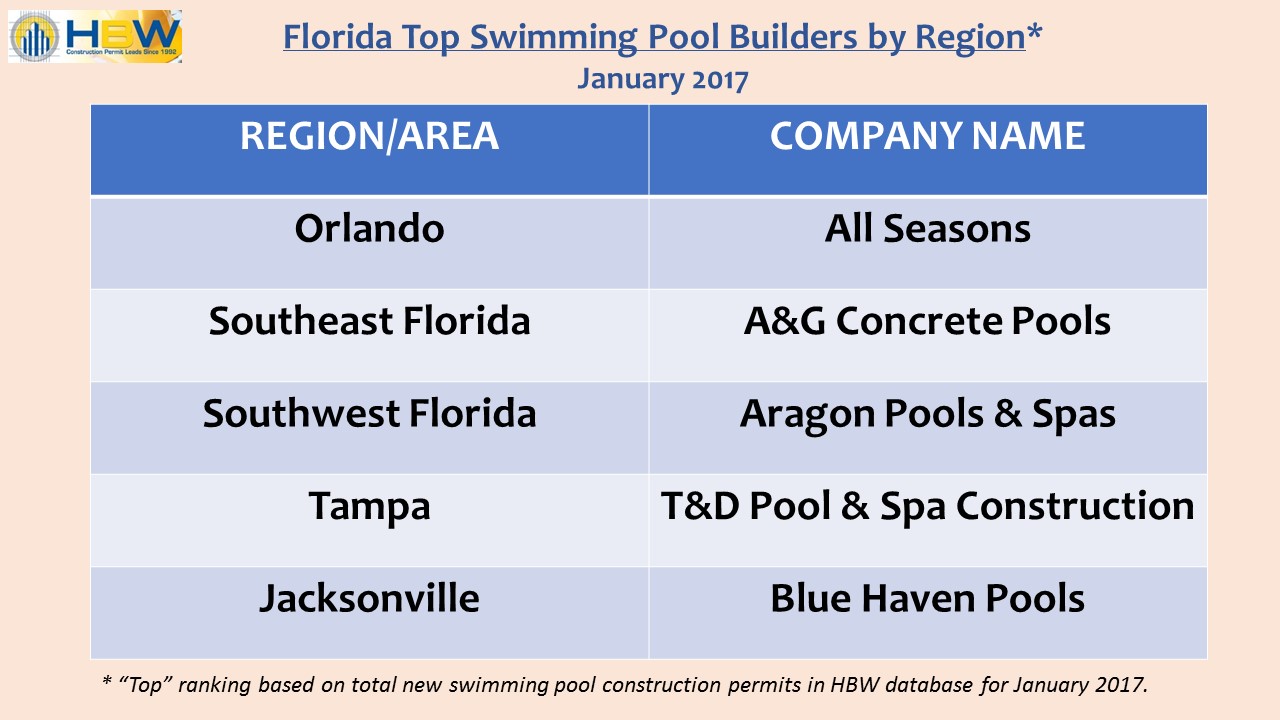
FL Top Pool Builders by Region – Jan. 2017
In Tampa, new swimming pool construction took place in all major counties last month, with the highest concentration of starts occurring in Hillsborough County. During the month of January, there were 277 pool starts and close to $11M in construction value in Tampa. Out of the five major regions reviewed, Tampa had the lowest average value of new swimming pool construction at $39,051, while the highest average value could be found in Jacksonville; the Jacksonville area experienced a 20% month-over-month increase in average value of new pool construction, topping the list at $47,306. In Jacksonville, new pool construction remained somewhat consistent with December’s totals as there were close to 160 starts and just about $7.5M in construction value. Approximately 70% of all pool starts took place in the counties of St. Johns and Duval, and the highest average value of construction could be found in St. Johns County at $52,456.
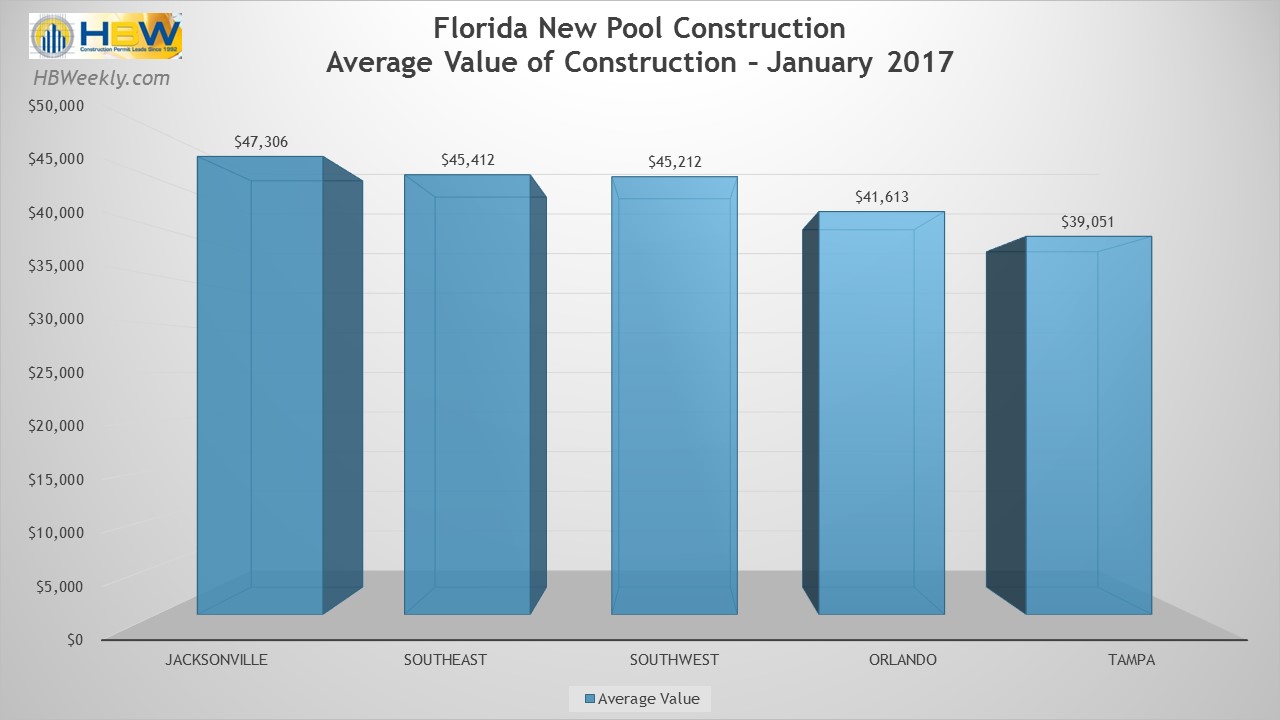
FL Average Value of New Pool Construction – Jan. 2017
Across the state, the counties with the highest concentration of pool starts could be found in south and central regions. Lee County (SW) had the most pool starts of any one county reviewed with 154 new permits and more than $7.5M in total construction value. Palm Beach (SE) and Orange County (Orlando) also experienced a high level of new pool construction last month with just about 135 starts taking place in each county.
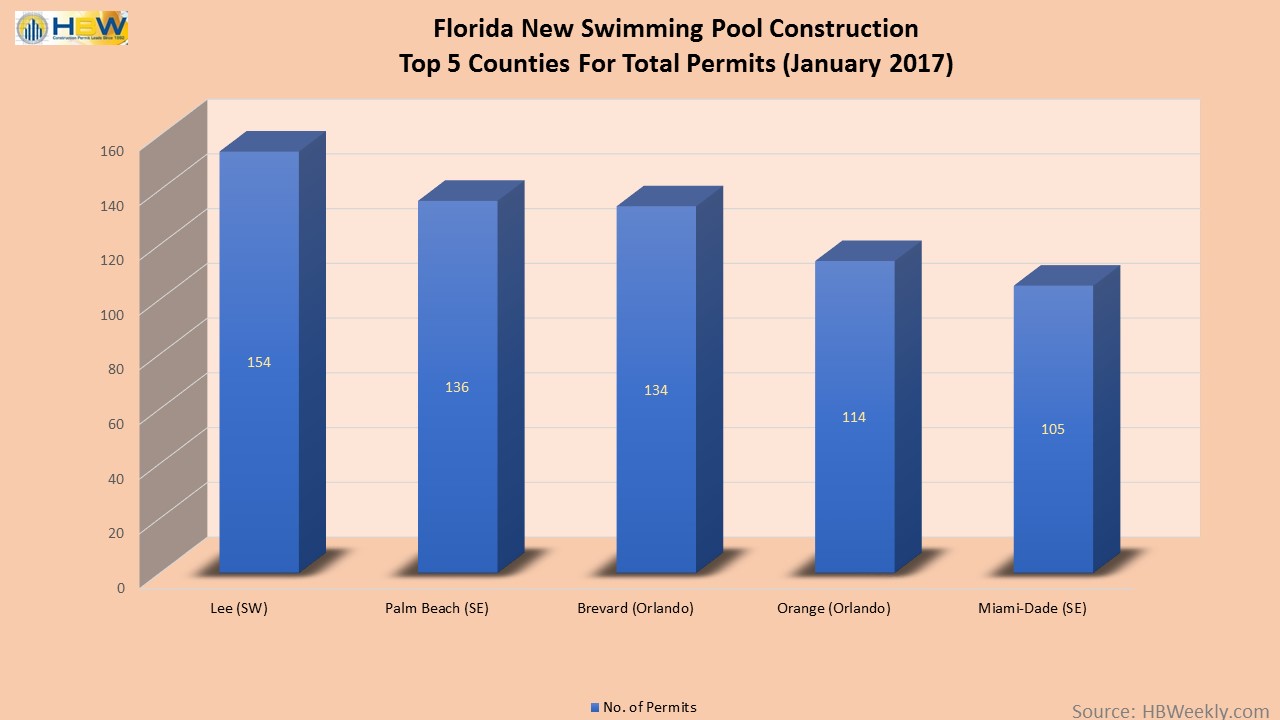
FL Top Counties for Swimming Pool Permits – Jan. 2017
Information utilized for the graphs and above listed figures for swimming pool construction in Florida was directly derived from HBW construction data reports. To gain access to the HBW database and receive custom and detailed reports on the latest residential and commercial building activity in Florida, Georgia, Texas, Alabama, and Oklahoma, please contact HBW for details.