
Last month, a few areas of Florida were booming when it came to swimming pool starts. Here’s a monthly view of the hot spots for new swimming pools in Florida.
Out of the 1,730 new swimming pool permits and $75M in construction value on file for Florida last month, HBW is honing in on the hottest spots for new pool construction. Overall, new pool construction is off to a slow but steady climb since the start of the year as the Sunshine State inched up in new pool permits by 3% since January. Although Orlando took the spotlight in January, the southwest region of Florida was the one to shine in February. Having experienced a month-over-month increase of 18%, new swimming pool construction is heating up SW Florida, especially in the counties of Lee and Collier. In February alone, there were nearly 520 pool starts in the area and approximately $22.5M in total value.
While Orlando did not reach the same level of activity as January, it still ranked second highest out of the five major regions (Southwest, Southeast, Tampa, Orlando, Jacksonville) reviewed. Out of the 362 pool starts and more than $15.2M of construction value in Orlando, the centrally-located county of Orange had the highest concentration of new permits (118 permits) and ranked third-highest statewide.
Other areas that spiked last month include Tampa and Jacksonville. Although ranked third highest for total swimming pool starts (336 permits, total value: $15.2M), the Tampa area had a 21% month-over-month increase, and its larger county of Hillsborough ranked fourth highest in the state for total starts. And while Jacksonville had the lowest amount of new construction, it is showing improvement since the start of the year. With a 17% increase in pool starts, Jacksonville had 187 permits and approximately $8.4M in construction value added to the HBW database last month.
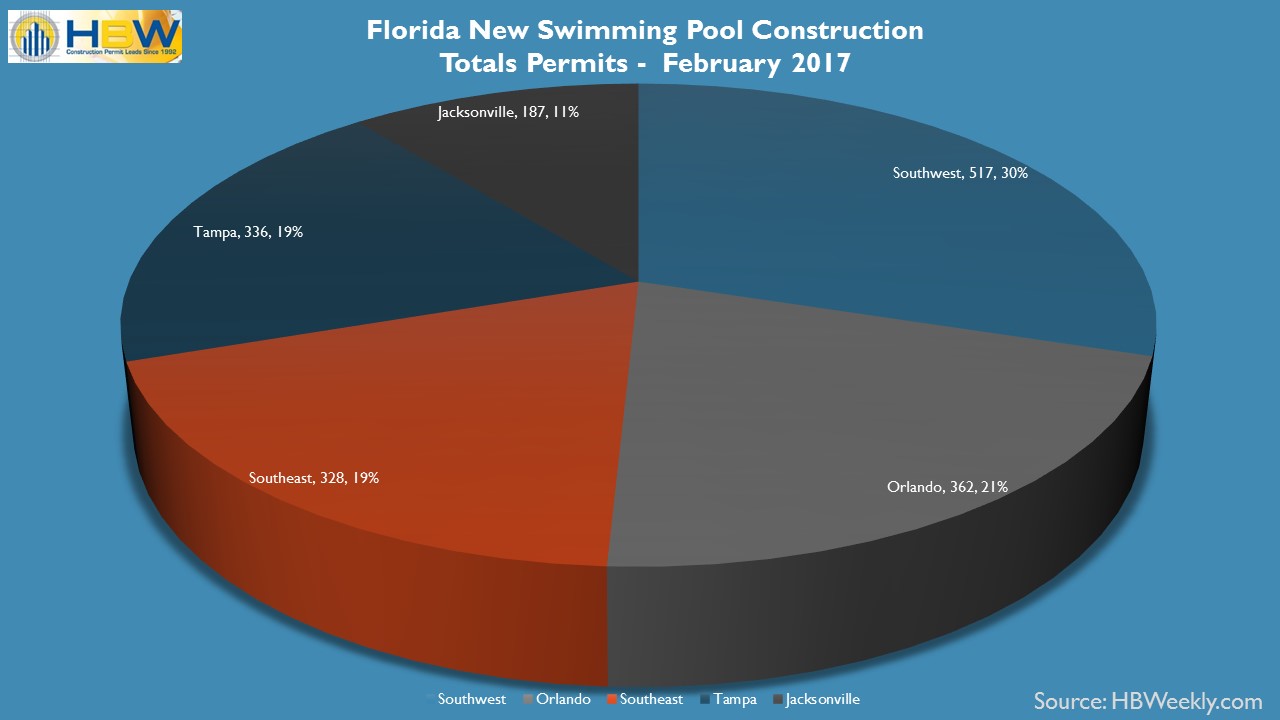
FL Total Pool Permits by Area – Feb. 2017
While new swimming pool construction has been steadily increasing since the start of the year, the average value of construction has been somewhat consistent with some fluctuations in certain areas. Statewide, the average value of construction has remained in the $40k-$48k range since the start of the year. Since January, Tampa and the southeast have experienced the most fluctuation in average value… Tampa’s 16% month-over-month increase resulted in an average value just over $45k, while the southeast’s 11% month-over-month decrease in average value landed it at $40.6k in February.

FL Average Value of Swimming Pool Construction – Feb. 2017
Finally, to the good stuff – the hot spots. As previously mentioned, the southwest region was in the lead last month for total pool starts. For this reason, it should come as no surprise that the southwest counties of Lee and Collier are ranked #1 and #2 for total new construction activity. Lee County has been at the top since the start of the year, and it remains consistent in starts each month with 154 new permits and just about $7.2M in construction value in February. While Collier County did not make the top five in January, it ranked second highest last month with 120 pool starts and just over $5M in total value. Coming in a close third, Orange County in Orlando had 118 new pool permits and a total value in excess of $5.2M. Hillsborough County (Tampa) and Miami-Dade (Southeast) closed the top five with 117 permits and 108 permits respectively.
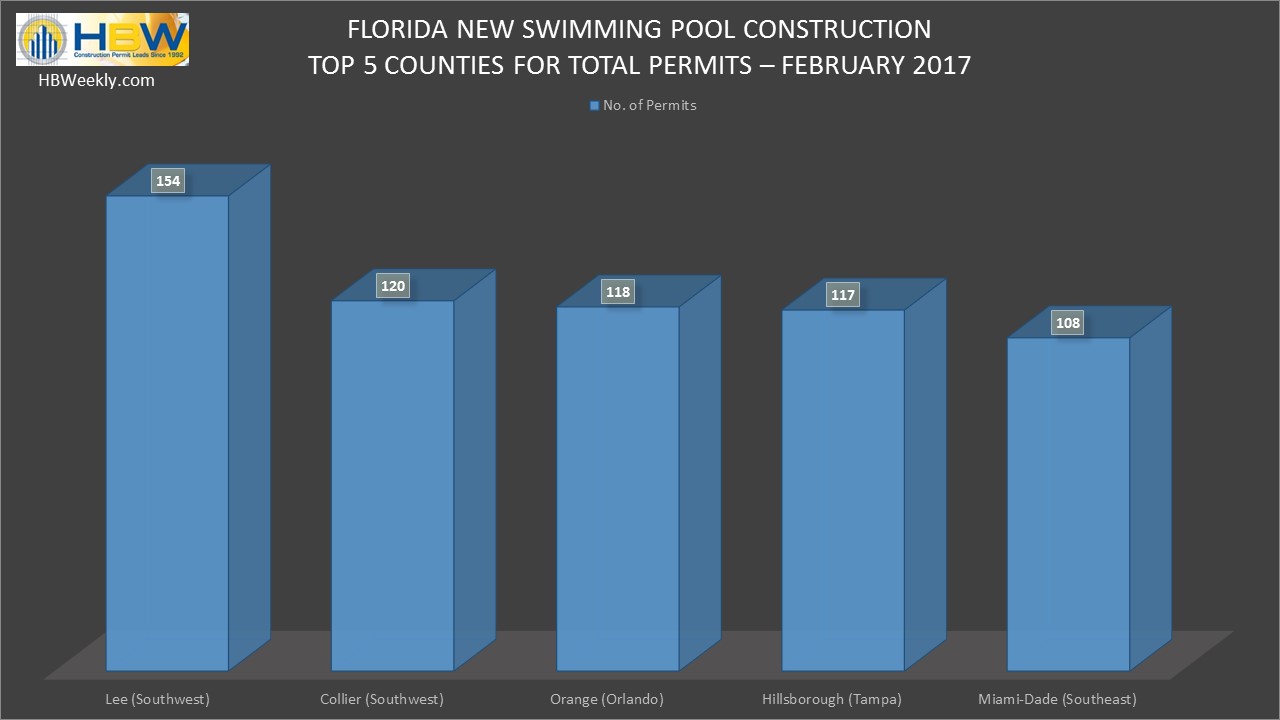
FL Top 5 Counties for Total Permits – Feb. 2017
Information utilized for the graphs and above listed figures for swimming pool construction in Florida was directly derived from HBW construction data reports. To gain access to the HBW database and receive custom and detailed reports on the latest residential and commercial building activity in Florida, Georgia, Texas, Alabama, and Oklahoma, please contact HBW for details.