
Just as the temperatures are dropping in Florida, new pool construction experienced a month-over-month dip in September.
Although new swimming pool construction in Florida was slower in September than August, there was still plenty of new activity across the state, resulting in more than 1,500 new permits with a total value of nearly $63M in the HBW database.
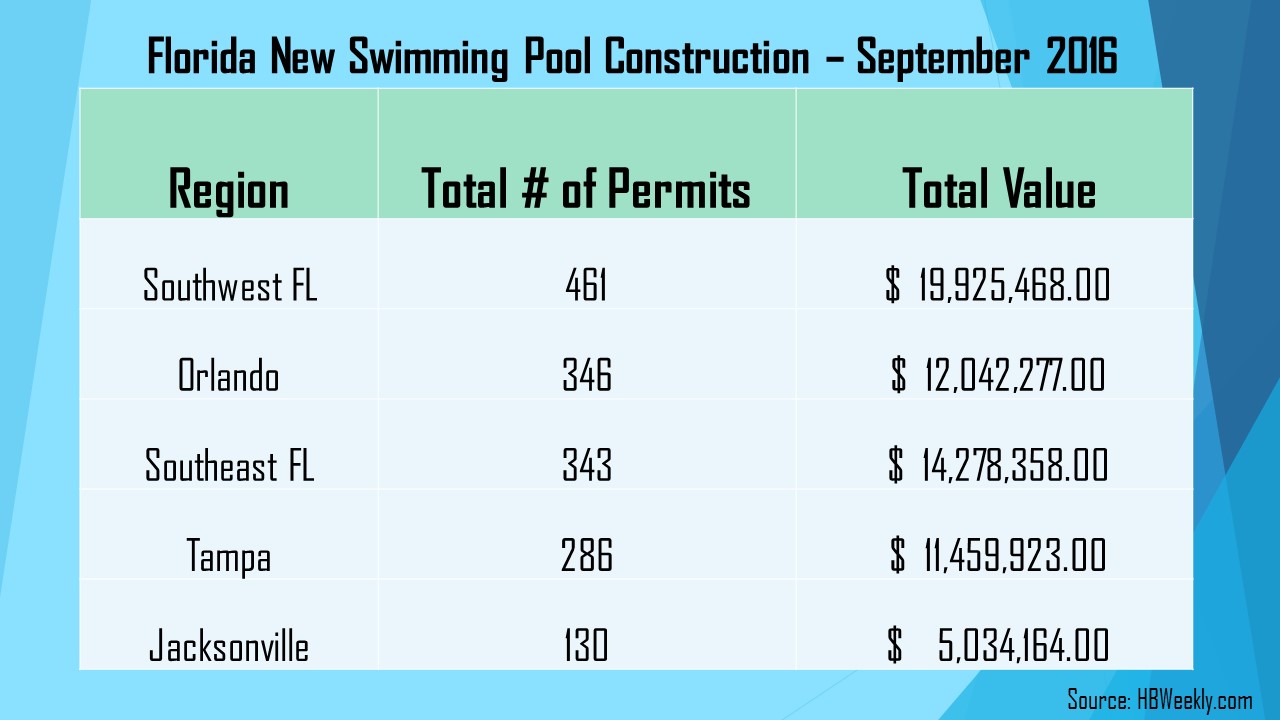
FL Swimming Pool Construction Permits – September 2016
Southwest Florida continued to hold the lead with 461 swimming pool permits and nearly $20M in total construction value. The centrally located area of Orlando was next highest and up one spot since August with 346 new permits and more than $12M in total value for the month. Running close behind in third was the southeast region with 343 new permits and more than $14M in construction value. Although all areas experienced a month-over-month dip in swimming pool construction, the line-up was somewhat consistent with August. The only exception was that Orlando bumped up a spot and switched ranking with Southeast Florida for the month; both areas continue to be neck and neck, and Jacksonville has remained at the lower end of the spectrum with 130 new pools in September.
The southwest region also took the lead for average value of new pool construction. Up one spot since August, southwest Florida had an average swimming pool construction value of more than $43k. Across the state, all regions were within less than a $10k range of each other. Southeast Florida and Jacksonville have been the most consistent in the average value of pool construction, with both areas having similar averages to those in August. Southeast Florida was second highest with an average value of nearly $42k, and Tampa held in third with an average value just over $40k. Since August, Orlando swapped positions with Jacksonville as it had the lowest average value of construction (~$35k) in September.
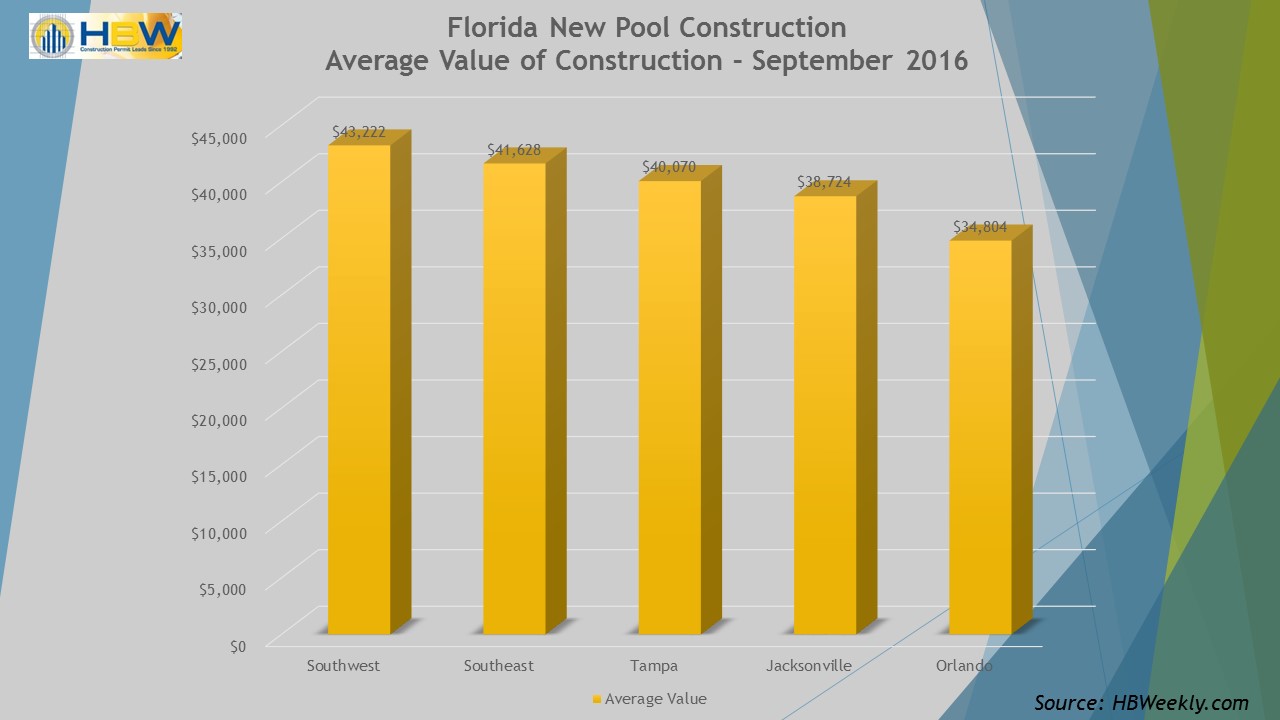
FL Average Value of Pool Construction – Sept. 2016
The Florida counties with the greatest concentration of new swimming pool construction activity on file with HBW run from the central portion of the state and down through the southeast and southwest. Since August, Lee and Palm Beach counties switched positions on the top ten list; coming in very close to each other for total permits, Lee County (SW) is now at #1 with 151 new permits and Palm Beach County (SE) is down to #2 with 149 new permits. Another southwestern county where swimming pool construction is plentiful is Collier County (120 permits), and the Orlando area’s counties of Orange and Osceola were experiencing similar levels of new pool construction, with each having 105 new permits on file for the one-month period.

FL Top 10 Counties for Pool Permits – Sept. 2016
Information utilized for the graphs and above listed figures for Florida swimming pool construction was directly derived from HBW construction data reports. To gain access to the HBW database and receive custom and detailed reports on the latest residential and commercial building activity in Florida, Georgia, Texas, Alabama, and Oklahoma, please contact HBW for details.